Big bank earnings reactions

The banks unofficially kicked off Q3 earnings season yesterday, and with investors already on edge amid elevated trade tensions, the reactions to these earnings were set up to be an important tell on near-term market direction. Luckily for the bulls, banks delivered, and today, we’ll look at what the charts say about five of the biggest financials following their earnings reports on Tuesday morning.
BlackRock (BLK) vaults to a new all-time high
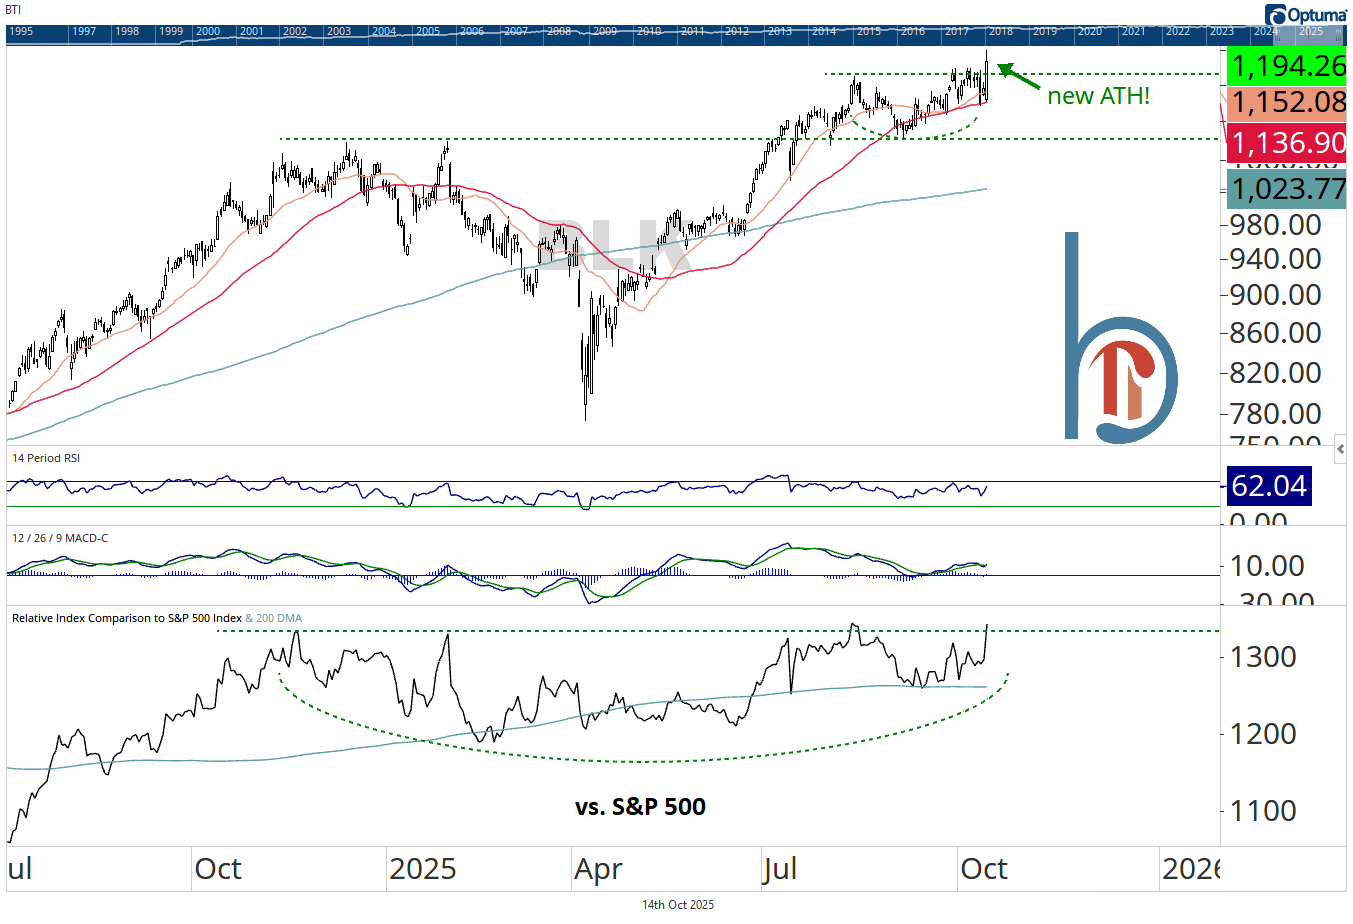
We’ll start with the one that isn’t a bank, but arguably has the best post-earnings chart: BlackRock. The world’s largest asset manager gained 3.4%, exploding off its 50-DMA and closing at a new all-time high. This completes a two-month base for BLK and conservatively targets $1,256/share.
JPMorgan holds the 50-day despite 4% intraday drop
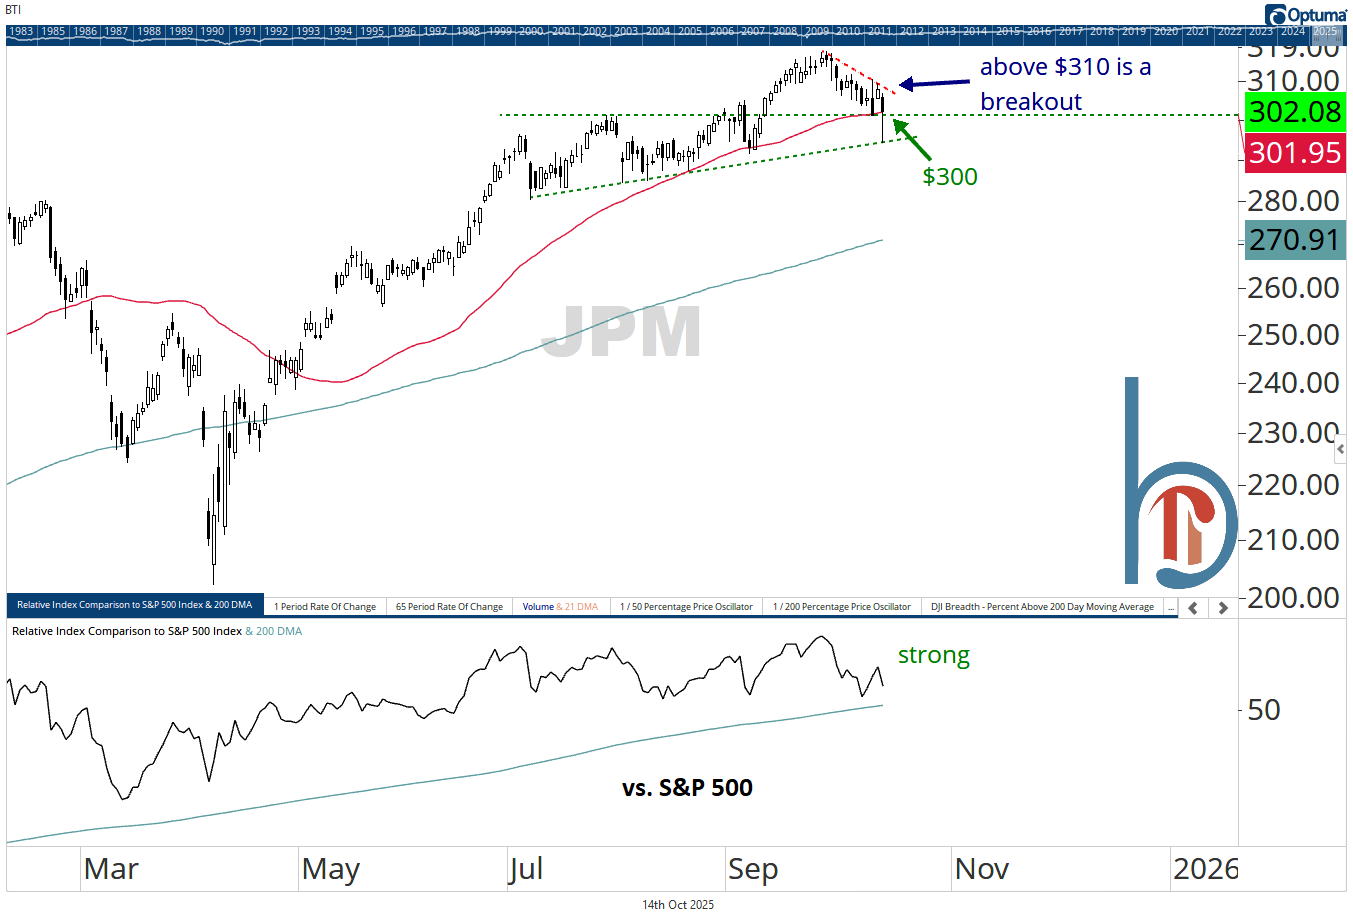
JPM was down as much as 4% on Tuesday but rallied to close with just a 1.9% loss. The save helped the stock maintain dual support near $300 and created a potential bullish reversal if we see confirmation today. A strong close above $310 would break the stock out, and likely continue its bullish relative trend.
Goldman has bull flag potential despite post-earnings drop
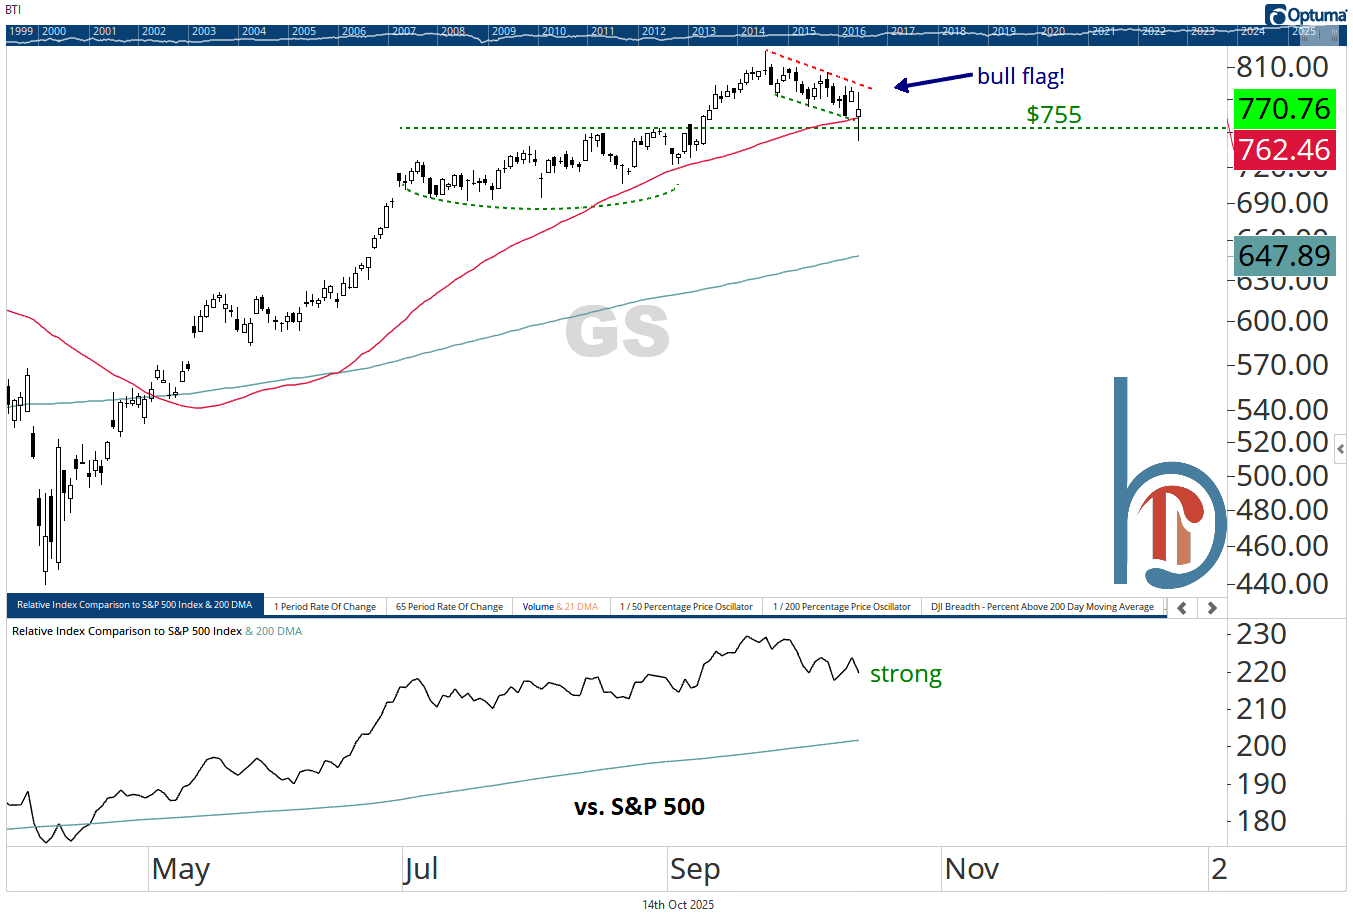
The worst performer of the stocks we’ll look at today, Goldman Sachs, fell 2% on Tuesday. However, like JPMorgan, the stock rallied off its intraday lows and managed to close above its 50-DMA and horizontal support. An orderly pullback, to a support zone, in a long-term uptrend, is something we always want to view opportunistically, and I like the setup for GS if we’re above yesterday’s lows ($742.46).
Citigroup holds key support zone, rallies 3.9%
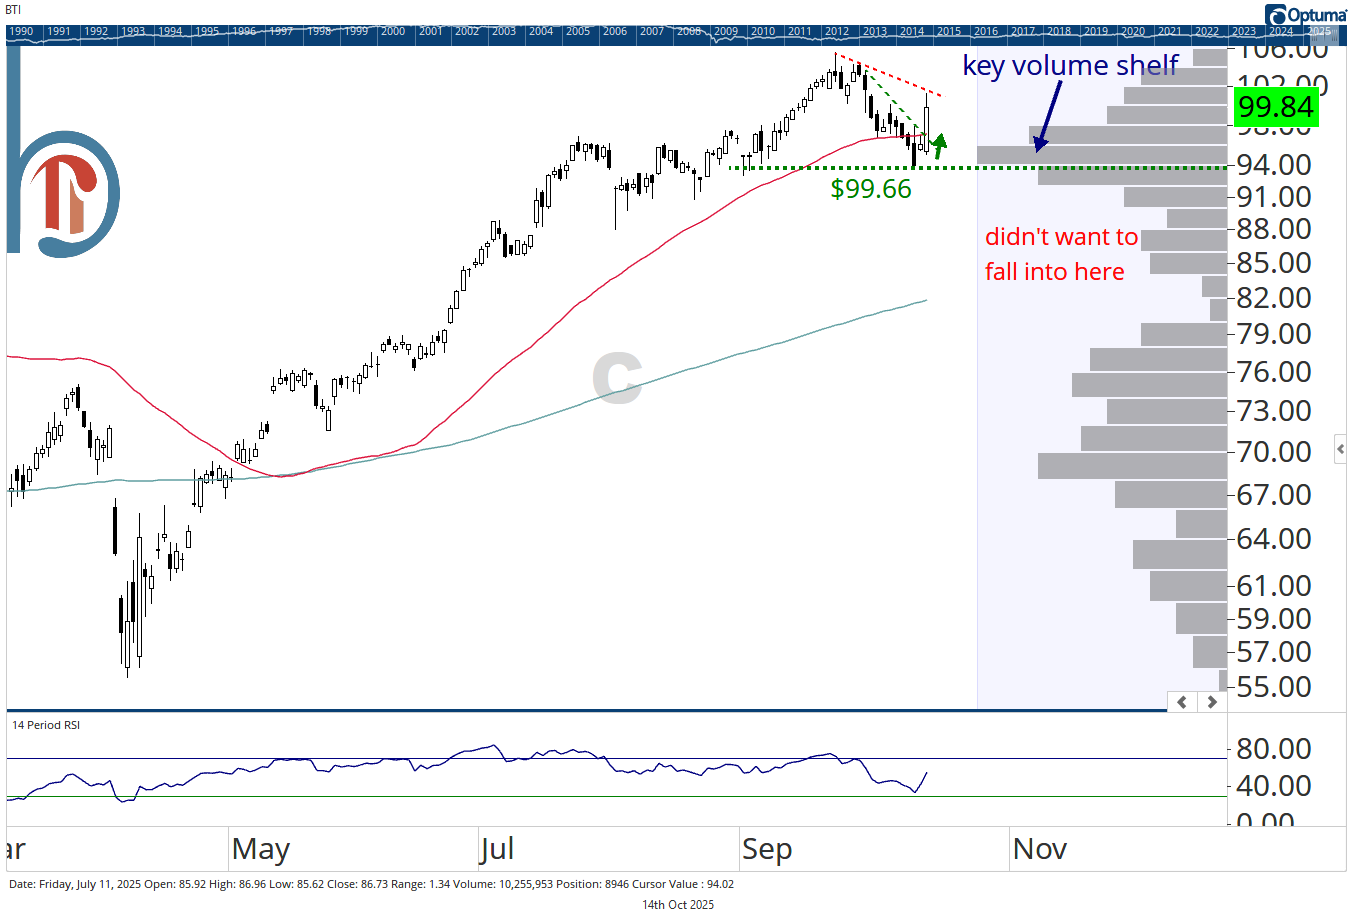
Citigroup came into Tuesday’s earnings call desperately needing to hold last Friday’s lows. As the volume bars on the right-hand side show, a break of $99.66 risked the stock falling into a volume pocket and possibly retesting the February highs near $85. However, investors liked what they heard and bid the stock up 3.9%. That broke a short-term downtrend line, but the stock did find some sellers at a secondary resistance level. Yesterday’s high ($101.22) will need to be eclipsed before C is a tactical buy.
Wells Fargo wins the day
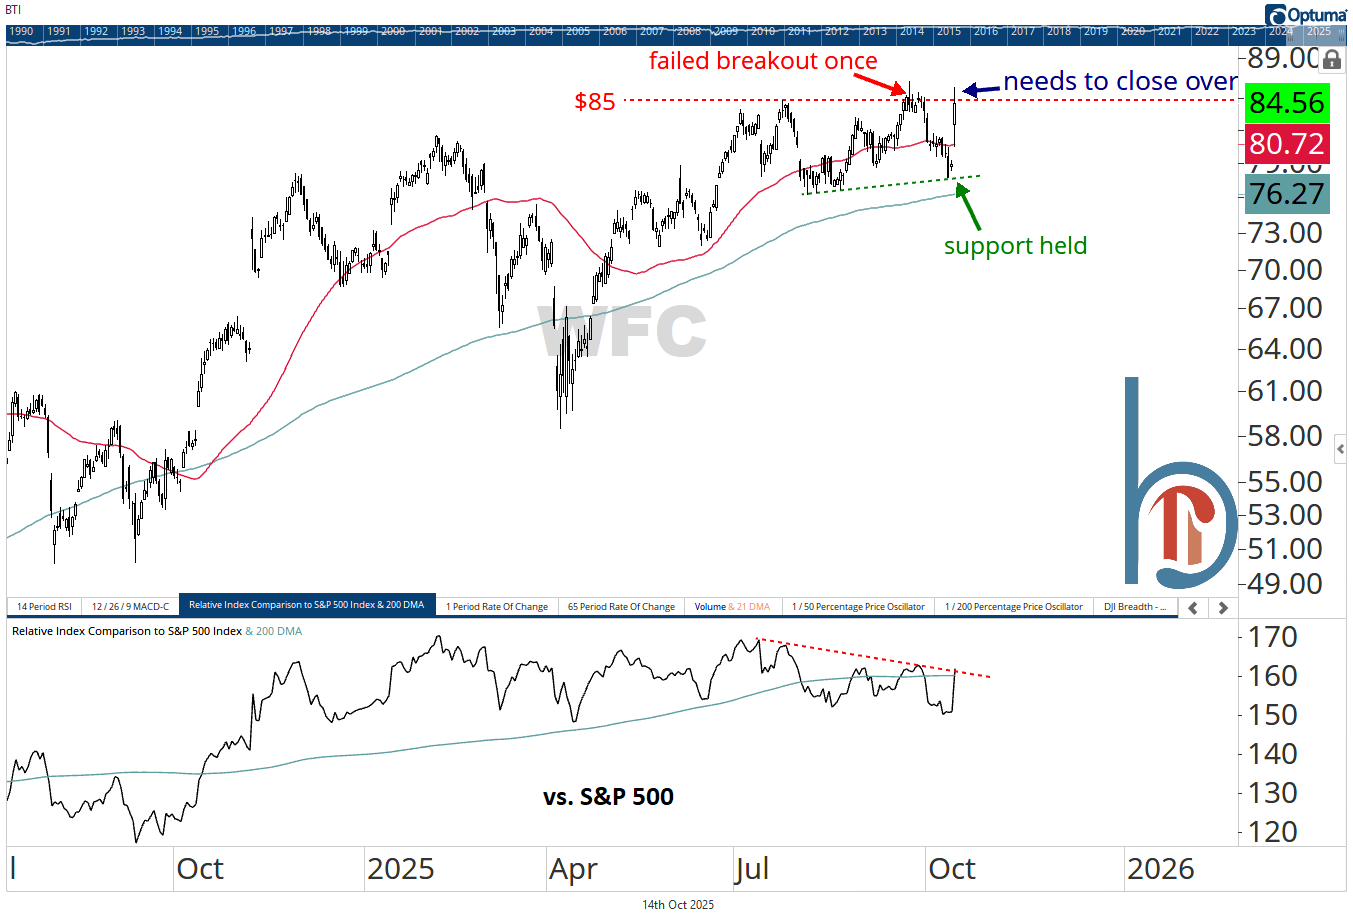
Wells Fargo won the day with a 7.2% gain that was nearly double the other financials reporters. That kept support intact and pushed the stock back up near multi-month resistance at $85. The stock tried and failed to close above there and couldn’t do it, but there are still three days to go in the week. A breakout above $85 would target $94 for WFC.
Final thoughts
Brown Technical Insights is neutral on the financials sector because it hasn’t had the volatility to keep up with the index in this high-beta, AI-driven market. However, the absolute trends are strong and for investors willing to pick stocks, there are opportunities with bullish relative trends. All five of the charts reviewed today have a positive outlook, but BlackRock has perhaps the best combination of a strong chart prior to Tuesday, and a bullish earnings reaction.
For ETF investors, $72 is the key support level to watch on KBWB, the Invesco KBW Bank ETF. If we’re above that level, the bull market in banks (and likely the broad market) is alive and well.
Unlock exclusive gold and silver trading signals and updates that most investors don’t see. Join our free newsletter now!
Unlock exclusive gold and silver trading signals and updates that most investors don’t see. Join our free newsletter now!
Author

CMT Association Research Team
CMT Association
The CMT Association is a global credentialing body that has served the financial industry for nearly 50 years.


