BHP Group Limited – BHP Elliott Wave analysis and technical forecast [Video]
![BHP Group Limited – BHP Elliott Wave analysis and technical forecast [Video]](https://editorial.fxsstatic.com/images/i/charts-02_XtraLarge.jpg)
ASX: BHP Group Limited - BHP Elliott Wave technical analysis
Our current Elliott Wave analysis focuses on BHP GROUP LIMITED (ASX: BHP), providing an updated view on potential market movements. The third wave (wave 3 navy) appears to be forming, with expectations of a strong upward movement. This report outlines the short-term outlook, trend potential, strategic entry zones, and critical invalidation levels of the bullish structure.
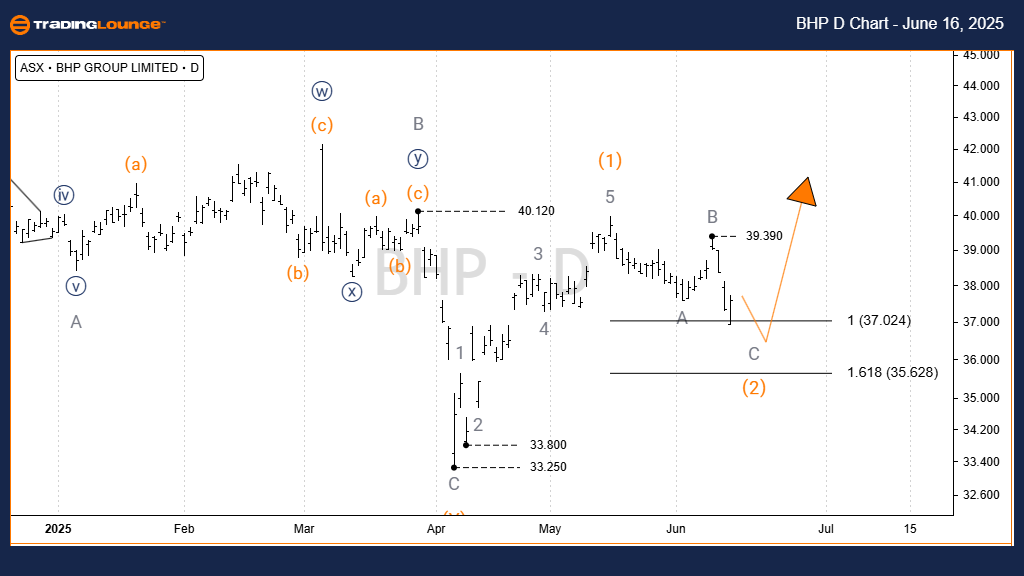
One-day chart (semilog scale) analysis
-
Function: Major Trend (Intermediate degree, orange).
-
Mode: Motive.
-
Structure: Impulse.
-
Position: Wave 3) - orange.
Details:
The previous wave 2)) - navy seems complete, signaling the onset of wave 3)) - navy. This is subdividing into wave 3) - orange. We project a potential rise towards 40.00. Before that, wave 2) - orange could retrace down to 37.024 - 35.628. A surge past 39.390 would confirm the next phase of wave 3) - orange.
Invalidation point: 33.25.
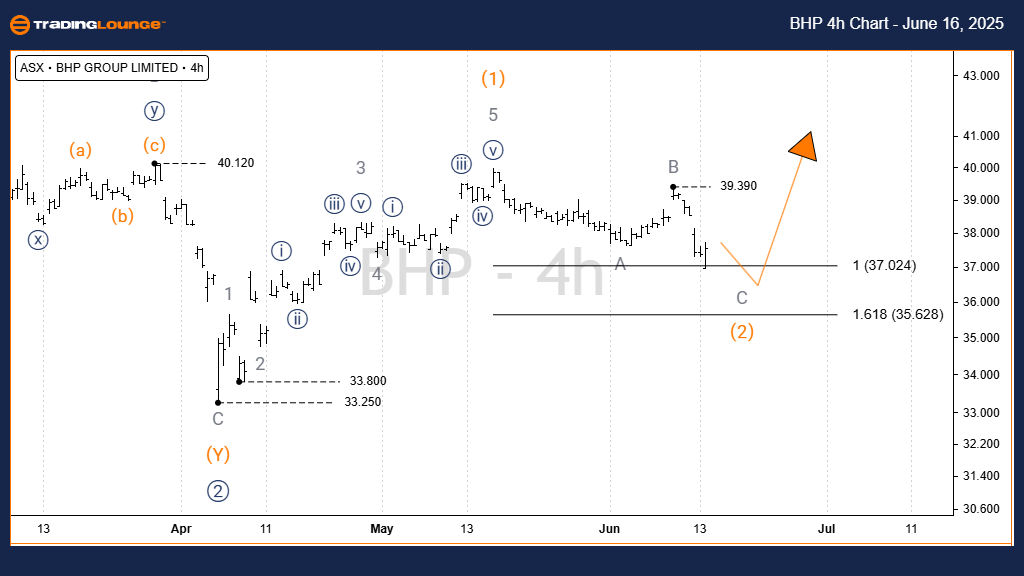
Four-hour chart analysis
-
Function: Major Trend (Intermediate degree, orange).
-
Mode: Motive.
-
Structure: Impulse.
-
Position: Wave 3) - orange.
Details:
Closer inspection reveals we are nearing the completion of wave 2) - orange, which includes a clear A-B-C (grey) sequence. Wave C - grey is now entering the anticipated reversal zone near 37.024 - 35.628. A strong rally from this area and a break above 39.390 would support the bullish case for wave 3) - orange taking hold.
Invalidation point: 84.83.
Conclusion
Our market assessment, covering trend projections and short-term expectations for BHP GROUP LIMITED (ASX: BHP), offers insight into effective trading strategies. Price levels mentioned act as key indicators, either validating or invalidating the projected wave path. These inputs provide traders with a professional and accurate framework for decision-making.
BHP Group Limited – BHP Elliott Wave analysis and technical forecast [Video]
Author

Peter Mathers
TradingLounge
Peter Mathers started actively trading in 1982. He began his career at Hoei and Shoin, a Japanese futures trading company.


