Bharat Electronics – BEL Elliott Wave technical analysis [Video]
![Bharat Electronics – BEL Elliott Wave technical analysis [Video]](https://editorial.fxsstatic.com/images/i/electronic-chips-02_XtraLarge.jpg)
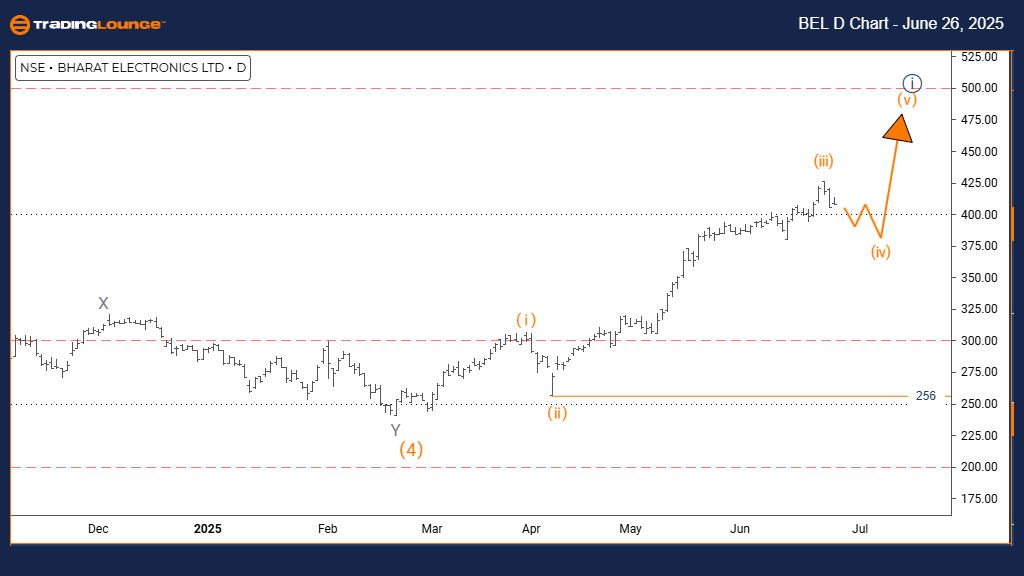
Bharat Electronics Elliott Wave analysis – Day chart
Function: Counter Trend.
Mode: Corrective.
Structure: Orange Wave 4.
Position: Navy Blue Wave 1.
Direction next higher degrees: Orange Wave 5.
Details: Orange Wave 3 appears complete, initiating Orange Wave 4.
Wave cancel/invalidation level: 256.
The daily chart analysis of BHARAT ELECTRONICS via Elliott Wave reveals a counter-trend movement within a corrective structure. The current phase reflects a pullback inside a broader trend, situated within Navy Blue Wave 1. This implies that the market is undergoing a standard correction prior to potentially resuming its primary trend direction.
The structure suggests the completion of Orange Wave 3, now transitioning into Orange Wave 4. This wave typically acts as a retracement phase that corrects a portion of the previous wave’s movement. The expected direction for the subsequent higher degree is Orange Wave 5, which should commence once Orange Wave 4 ends and may continue the prevailing trend.
Currently, BHARAT ELECTRONICS is navigating Orange Wave 4, following the completion of Orange Wave 3. The corrective dynamics imply potential sideways movements or slight pullbacks. The positioning inside Navy Blue Wave 1 further confirms that the market is in a correction stage within an ongoing broader structure.
One key technical level to monitor is the wave invalidation point at 256. A price drop below this threshold would invalidate the current Elliott Wave structure and necessitate a fresh analysis. As long as the price stays above this level, the corrective pattern remains valid.
Traders are advised to closely watch the development of Orange Wave 4, as its completion will signal the possible start of Orange Wave 5. The counter-trend characteristics imply short-term consolidation in price action before resumption of the primary trend.
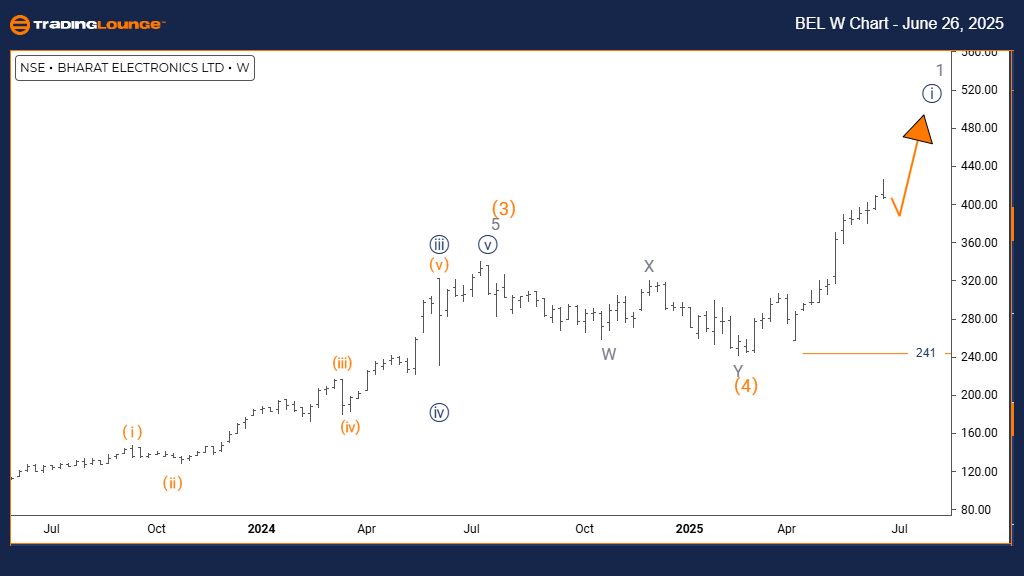
Bharat Electronics Elliott Wave Analysis – Weekly Chart
Function: Bullish Trend.
Mode: Impulsive.
Structure: Navy Blue Wave 1.
Position: Gray Wave 1.
Direction next lower degrees: Navy Blue Wave 2.
Details: Navy Blue Wave 1 is ongoing.
Wave cancel/invalidation level: 256.
The BHARAT ELECTRONICS weekly Elliott Wave analysis shows a bullish trend supported by an impulsive wave pattern. The current structure is identified as Navy Blue Wave 1, which fits into a broader formation as part of Gray Wave 1. This setup suggests the stock is in the early phase of a larger upward trend.
Ongoing development of Navy Blue Wave 1 within Gray Wave 1 typically signals the start of a new bullish movement. This wave phase often reflects strong directional progress. Once this wave concludes, the expected subsequent movement at a smaller scale is Navy Blue Wave 2, likely to present as a corrective pullback before the upward trend resumes.
An essential technical point is the wave invalidation level at 256. A price move below this value would nullify the existing wave analysis and call for a reevaluation of the bullish outlook. As long as this level holds, the upward trend assumption remains intact.
Current technical indicators position BHARAT ELECTRONICS for continued upward activity, with Navy Blue Wave 1 actively forming inside Gray Wave 1. The impulsive nature of this wave reflects strong buying interest and points toward potential significant gains.
Bharat Electronics – BEL Elliott Wave technical analysis [Video]
Author

Peter Mathers
TradingLounge
Peter Mathers started actively trading in 1982. He began his career at Hoei and Shoin, a Japanese futures trading company.


