Beyond Meat Earnings Preview: Dismal BYND Q3 forecast has investors keeping distance
- Wall Street is expecting a loss of $0.39 per share for BYND.
- Beyond Meat executives cut Q3 revenue expectations from an average of $130 million.
- BYND stock is down about 55% from its 2021 high.
Beyond Meat (BYND) stock is down 0.2% to $97.80 in Wednesday's premarket ahead of third-quarter earnings expected after the close. Poor analyst expectations and a management revenue revision appear to be the culprits.
Beyond Meat (BYND) Earnings Preview: QoQ revenue drop impresses no one
Wall Street consensus has the plant-based burger maker losing -$0.39 a share, which would amount to a 43% drop YoY. The 12% rise in YoY quarterly revenues at $106.1 million is also a far cry from the fast-paced sales growth the company's investors had grown accustomed to. For the full fiscal years of 2019 and 2020, revenues grew nearly 37%.
The coming earnings release is also a drop-off from the previous quarter when Beyond Meat reported a loss of -$0.31 a share on revenue of $149.4 million.
BYND stock has received 8 downward revisions and 2 upward revision to its full-year earnings forecast in the past 90 days.
BYND has a current market capitalization of $6.2 billion, which seems low now that its primary competitor, Impossible Food, is in talks to $500 million at a post-valuation of $7 billion.
Beyond Meat told investors several weeks ago not to expect the earlier forecast of revenue between $120 and $140 million for the third quarter, which caused the latest ongoing sell-off.
| Market Cap | $6.2 billion |
| Price/Earnings | 600 |
| Price/Sales | 13.8 |
| Price/Book | 24.7 |
| Enterprise Value | $6.4 billion |
| Operating Margin | -15.8% |
| Profit Margin |
-20.1% |
| 52-week high | $221 |
| 52-week low | $91.55 |
| Short Interest | 27% |
| Average Wall Street Rating and Price Target | Hold $94.31 |
Beyond Meat (BYND) Stock Chart Analysis: Q3 results will determine the next trajectory
BYND stock has been falling for months ever since it reached an all-time high of $221 reached in late January of this year. Another swing high in July quickly gave up, and now BYND has a one-year chart that looks particularly rough. The stock is down about 55% from its all-time high in January.
Beyond Meat shares have been swimming in a descending price channel for most of the year. As of now on the weekly chart, BYND price is quite close to the bottom. A break below $90.84, the bottom of the descending price channel, would signal that there is more pain to come. Short interest of 27% of shares outstanding and 32% of the float is worrisome.
Long-term support sits all the way down at $75 from the end of 2019. Otherwise, A true sell-off could take BYND shares as low as $58, where Beyond Meat stock price found support in March of 2020.
Many traders may look at the same chart and wonder what a positive earnings turn could do for BYND price. The first target should be the $103.49 level where the 9-day Exponential Moving Average (EMA) currently provides resistance. Triumphing over this barrier would give bulls the chance to attack the 21-day EMA at $12.89. Besting that challenge would give bulls free rein to run up to the top of the price channel at $139.84.
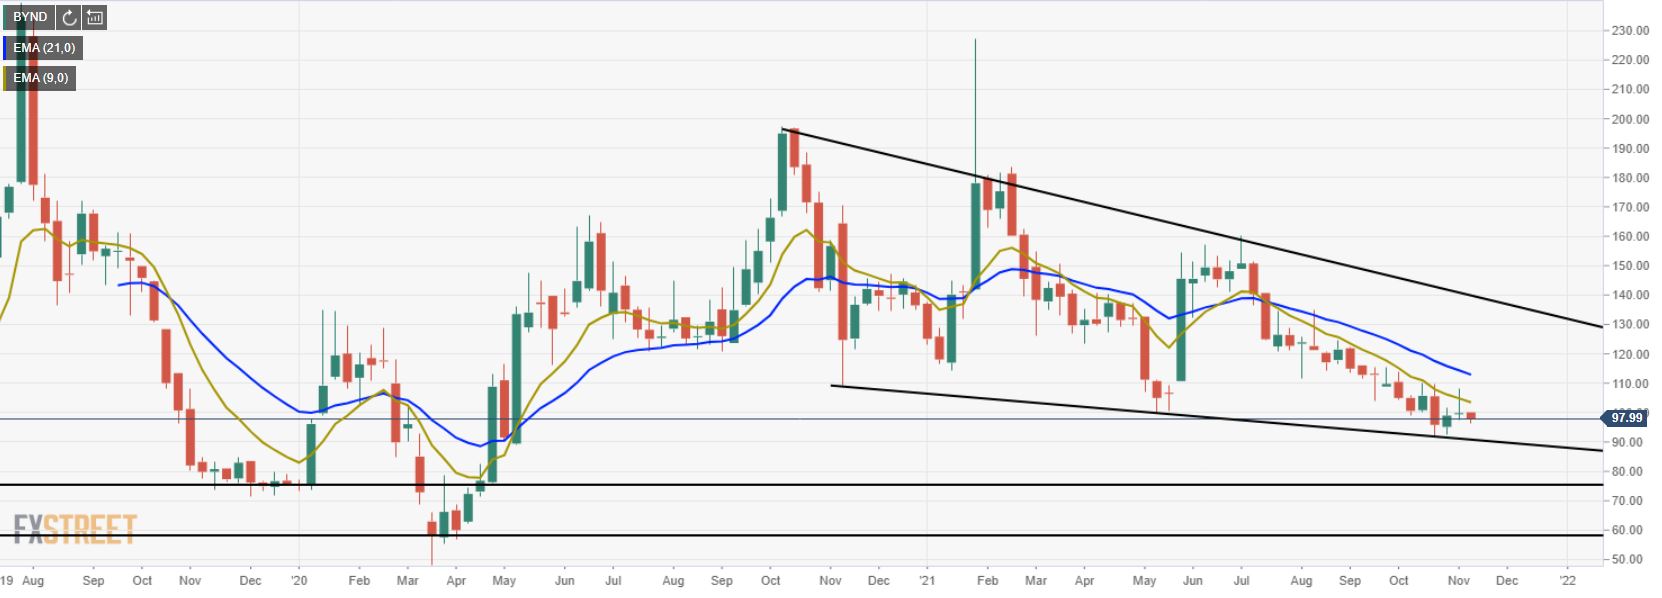
BYND weekly chart
Premium
You have reached your limit of 3 free articles for this month.
Start your subscription and get access to all our original articles.
Author

Clay Webster
FXStreet
Clay Webster grew up in the US outside Buffalo, New York and Lancaster, Pennsylvania. He began investing after college following the 2008 financial crisis.


