|

Berkshire Hathaway Inc. (BRK.B) Elliott Wave technical analysis

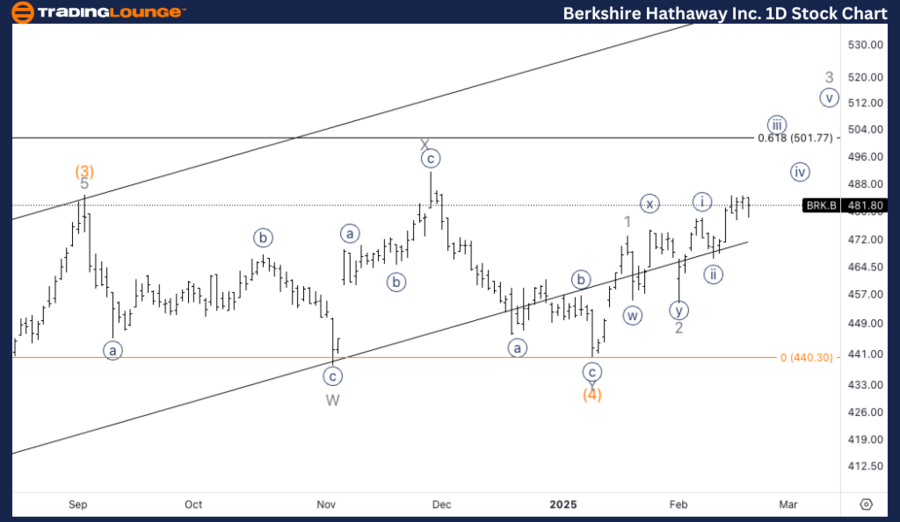
Berkshire Hathaway Inc. (BRK.B) – Elliott Wave analysis (daily chart)

  • Function: Trend.

  • Mode: Impulsive.

  • Structure: Motive.

  • Position: Wave 3 of (5).

  • Direction: Upside into Wave 3.

Details:

  • Expecting upside movement into Minor Wave 3 as we approach TradingLevel5 at $500.

  • Looking for a clear subdivision within Wave 3.

Chart

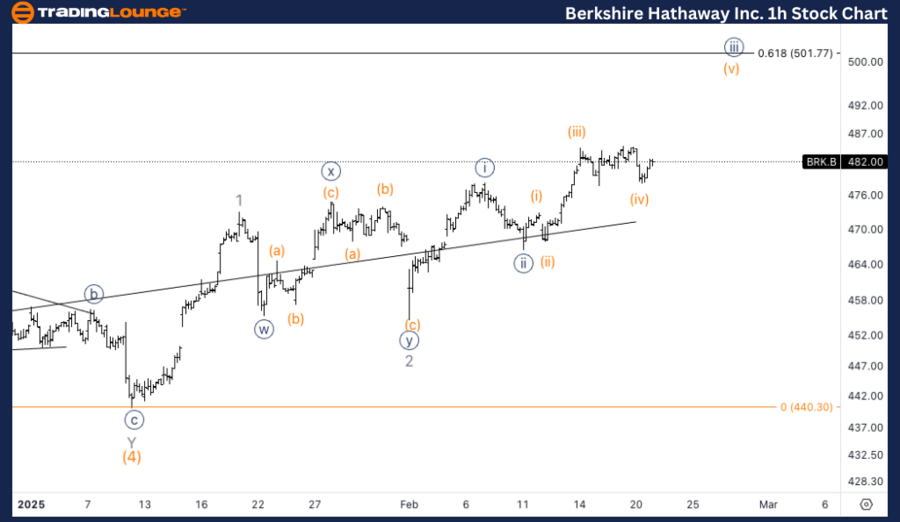
Berkshire Hathaway Inc. (BRK.B) – Elliott Wave analysis (one-hour chart)

  • Function: Trend.

  • Mode: Impulsive.

  • Structure: Motive.

  • Position: Wave {iii} of 3.

  • Direction: Upside in Wave {iii}.

Details:

  • Wave {iii} is developing, and we might be missing one leg higher into Wave (v) of {iii}.

  • Looking for a potential subdivision in Wave {iii} to confirm the next movement.

Chart

Summary of BRK.B Elliott Wave analysis

Daily chart

Berkshire Hathaway (BRK.B) remains in an impulsive phase within Wave 3 of (5), following a motive structure. The price is pushing higher within Minor Wave 3, with a target around $500. Expect further upside as Wave 3 unfolds, with clear subdivisions forming within the internal wave structure.

One-hour chart

On the 1-hour chart, BRK.B continues to progress through Wave {iii} of 3. The structure in Wave {iii} suggests additional upside potential, with one final leg expected to complete Wave (v) of {iii}. This would indicate more upward momentum ahead.

Berkshire Hathaway Inc. (BRK.B) Elliott Wave technical analysis

Author

Peter Mathers

Peter Mathers

TradingLounge

Peter Mathers started actively trading in 1982. He began his career at Hoei and Shoin, a Japanese futures trading company.

More from Peter Mathers
Share:

Markets move fast. We move first.

Orange Juice Newsletter brings you expert driven insights - not headlines. Every day on your inbox.

By subscribing you agree to our Terms and conditions.

Editor's Picks

EUR/USD recovers to 1.1750 region as 2025 draws to a close

Following the bearish action seen in the European session on Wednesday, EUR/USD regains its traction and recovery to the 1.1750 region. Nevertheless, the pair's volatility remains low as trading conditions thin out on the last day of the year.

GBP/USD stays weak near 1.3450 on modest USD recovery

GBP/USD remains under modest beairsh pressure and fluctuates at around 1.3450 on Wednesday. The US Dollar finds fresh demand due to the end-of-the-year position adjustments, weighing on the pair amid the pre-New Year trading lull. 

Gold retreats to $4,300 area, looks to post monthly gains

Gold stays on the back foot on the last day of 2025 and trades near $4,300, possibly pressured by profit-taking and position adjustments. Nevertheless, XAU/USD remains on track to post gains for December and extend its winning streak into a fifth consecutive month.

Bitcoin, Ethereum and XRP prepare for a potential New Year rebound

Bitcoin, Ethereum, and Ripple are holding steady on Wednesday after recording minor gains on the previous day. Technically, Bitcoin could extend gains within a triangle pattern while Ethereum and Ripple face critical overhead resistance. 

Economic outlook 2026-2027 in advanced countries: Solidity test

After a year marked by global economic resilience and ending on a note of optimism, 2026 looks promising and could be a year of solid economic performance. In our baseline scenario, we expect most of the supportive factors at work in 2025 to continue to play a role in 2026.

Crypto market outlook for 2026

Year 2025 was volatile, as crypto often is.  Among positive catalysts were favourable regulatory changes in the U.S., rise of Digital Asset Treasuries (DAT), adoption of AI and tokenization of Real-World-Assets (RWA).