Bearish signal spotted at key resistance level [Video]
![Bearish signal spotted at key resistance level [Video]](https://editorial.fxstreet.com/images/TechnicalAnalysis/ChartPatterns/Candlesticks/digital-tablet-with-stock-charts-30235834_XtraLarge.jpg)
Watch the video below extracted from the WLGC session before the market open on 28 May 2024 to find out the following:
-
The significance of volume spikes and bearish change of character bars in predicting market trends.
-
The pivot level to confirm the reversal signal.
-
The possible scenarios for market trends based on the current trading range and volume patterns.
-
The immediate downside target for the S&P 500 upon confirmation of the reversal signal.
Market environment
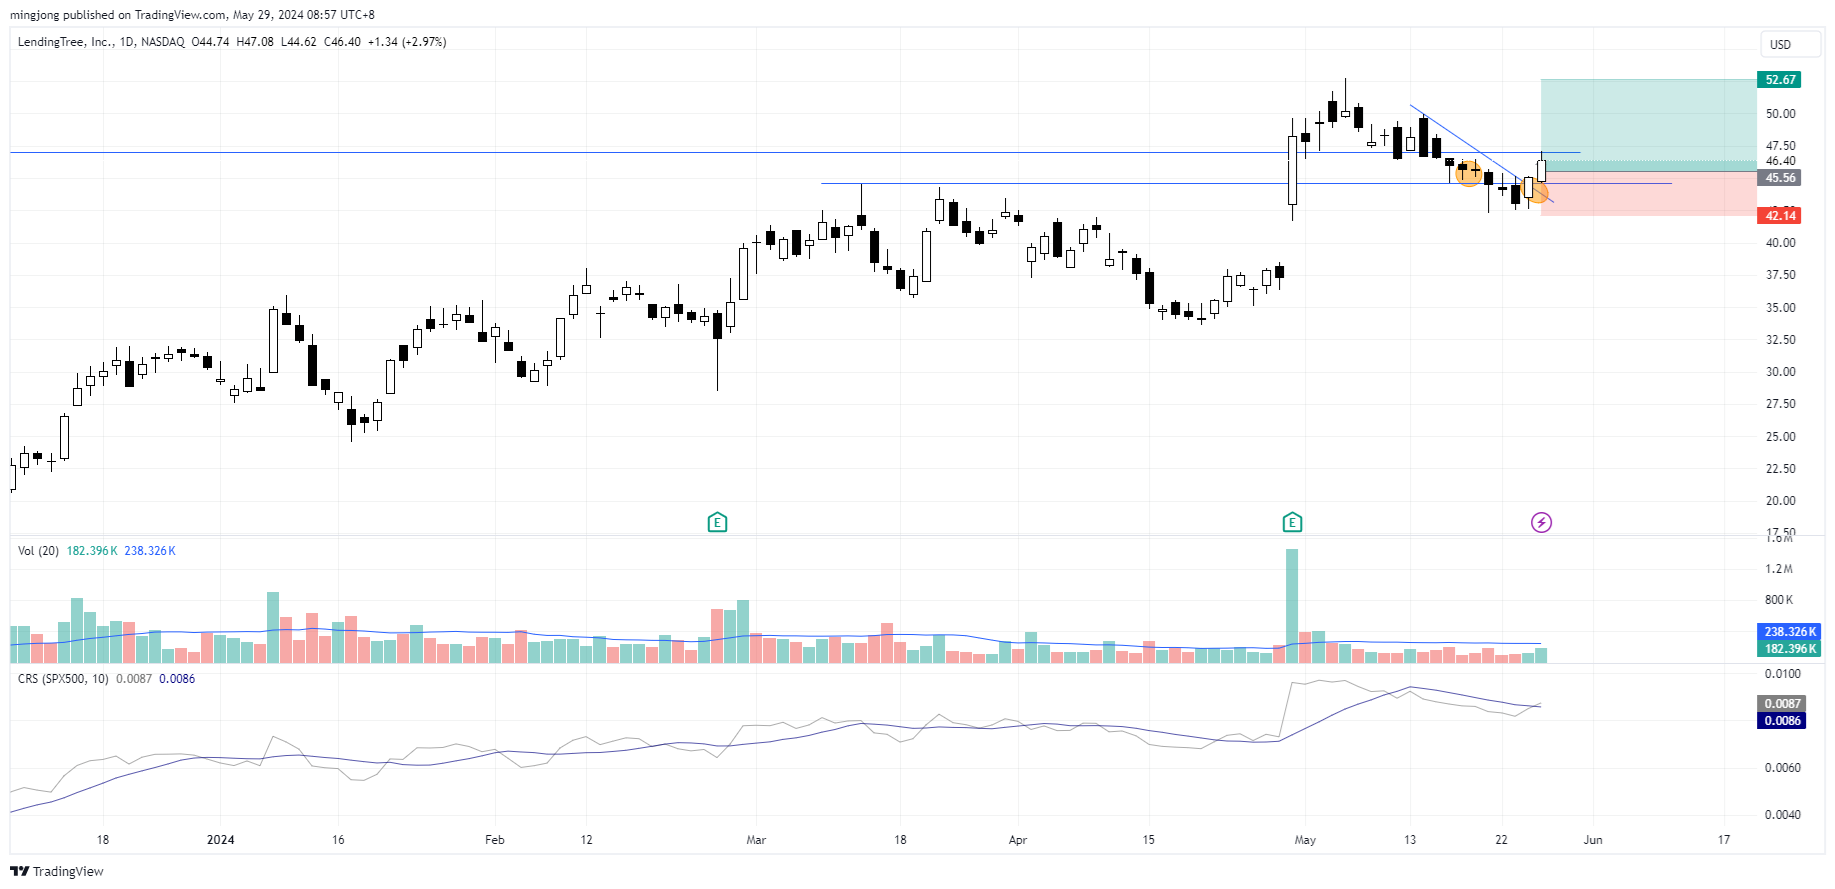
The bullish vs. bearish setup is 408 to 155 from the screenshot of my stock screener below.
The bearish change of character bar with a spike of supply popped up at the all-time high resistance as discussed in the video is a red flag.
On top of that, both the short-term and the long-term market breadth deteriorate. The equal weight RSP forming a lower high further confirms the lack of participation of the broad market.
Don’t get overly bearish despite the bearish conditions while we are still waiting for the reversal signal for confirmation.
So far, the note I posted on last Friday (after Thursday’s change of character bar) is still valid.
Three stocks ready to soar
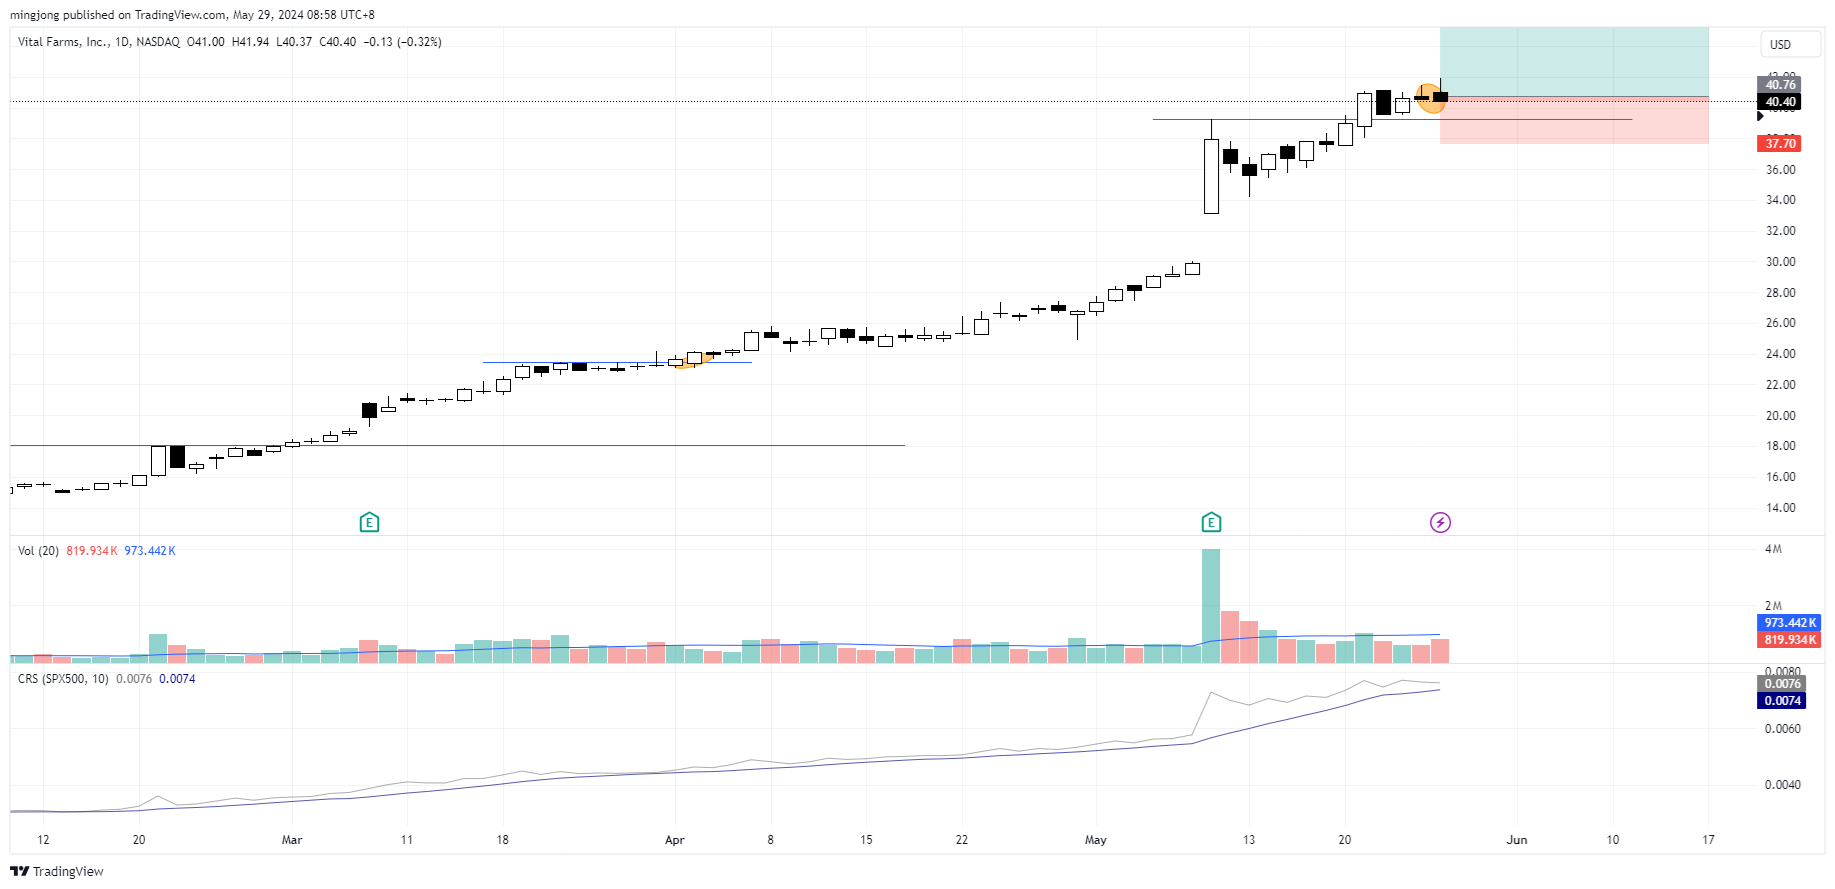
9 “low-hanging fruits” TREE, VITL trade entries setups + 10 actionable setups MU were discussed during the live session before the market open (BMO).
TREE
VITL
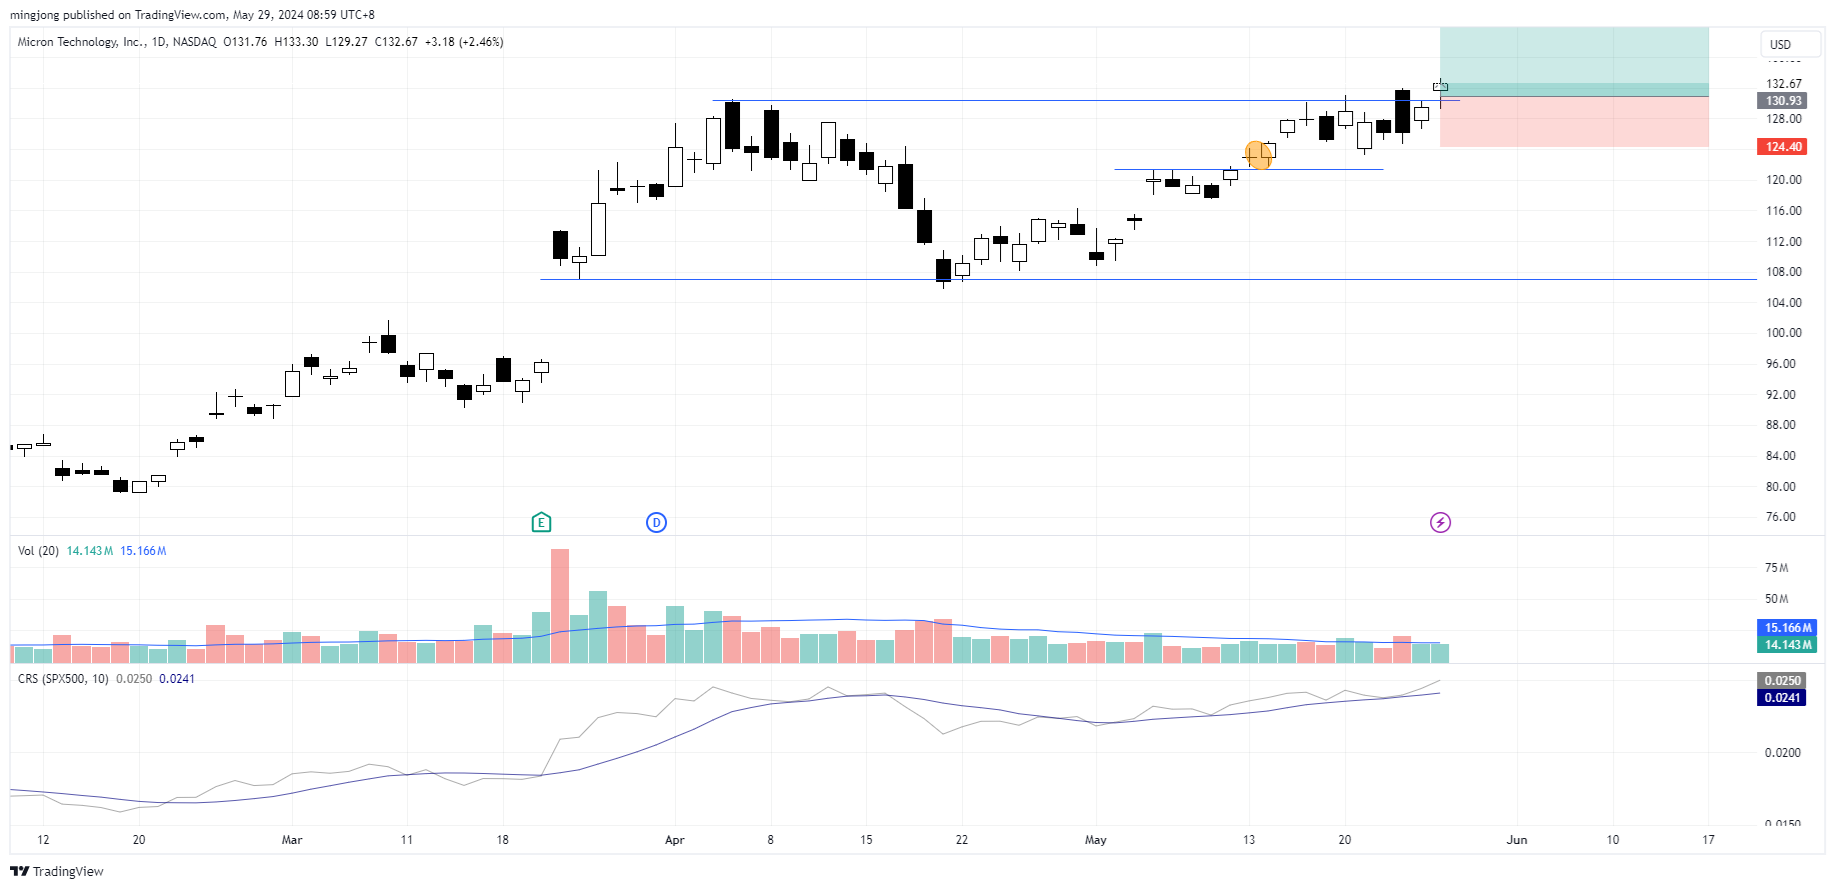
MU
Author

Ming Jong Tey
Independent Analyst
Ming Jong Tey has been trading since 2008. He started his learning journey from technical analysis (indicators, Fibonacci, etc...) to value investing. Throughout his journey, he develops an interest in price action with chart pattern trading.


