|premium|

Bank of America Corp (BAC Stock) Elliott wave view: Forecasting the wave 4 pullback

In this technical blog, we will look at the past performance of 1 hour Elliott Wave Charts of Bank of America ticker symbol: BAC, which we presented to members at the elliottwave-forecast . In which, the rally from 25 March 2021 low ended 5 waves impulse rally in a lesser degree cycle and made a pullback lower. And we knew that the structure is incomplete for 1 more high at least to complete the 5 waves sequence & it should see more strength. Therefore, we advised members not to sell the stock & buy the dips in 3, 7, or 11 swings at the blue box areas. We will explain the structure & forecast below:

BAC 1 hour Elliott Wave chart

BAC

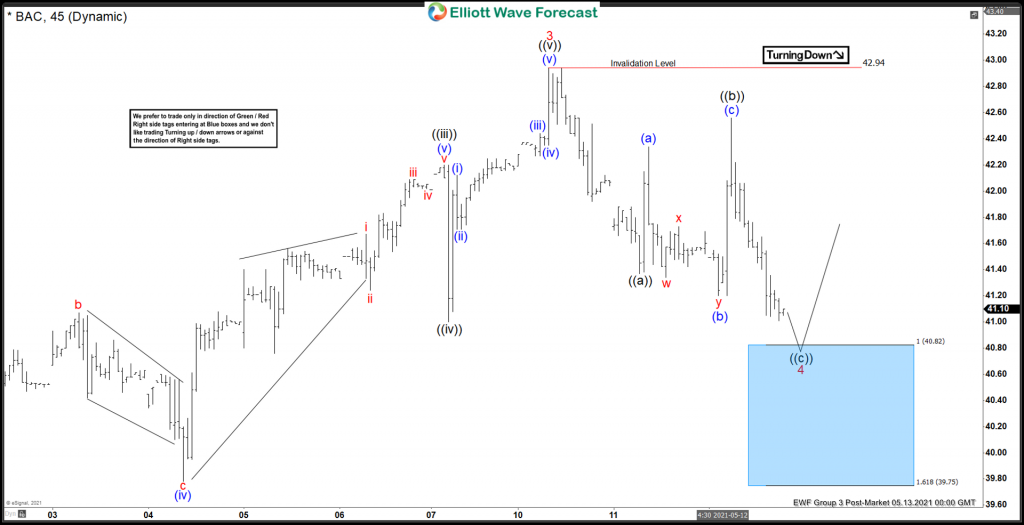
Above is the 1hr Elliott wave chart of BAC from 5/13/2021 Post-Market update. In which the rally to $42.94 high ended the cycle from 3/25/2021 low in 5 waves structure within wave 3. Down from there, the stock made a pullback in wave 4. The internals of that pullback unfolded as Elliott wave zigzag structure where wave ((a)) ended at $41.37 low. Wave ((b)) bounced ended as a lesser degree flat structure at $42.56 high and wave ((c)) was expected to reach the $40.82- $39.75 blue box area. From where next leg higher was expected to take place looking for a new high ideally or for a 3 wave bounce at least.

BAC latest 1 hour Elliott Wave chart

BAC

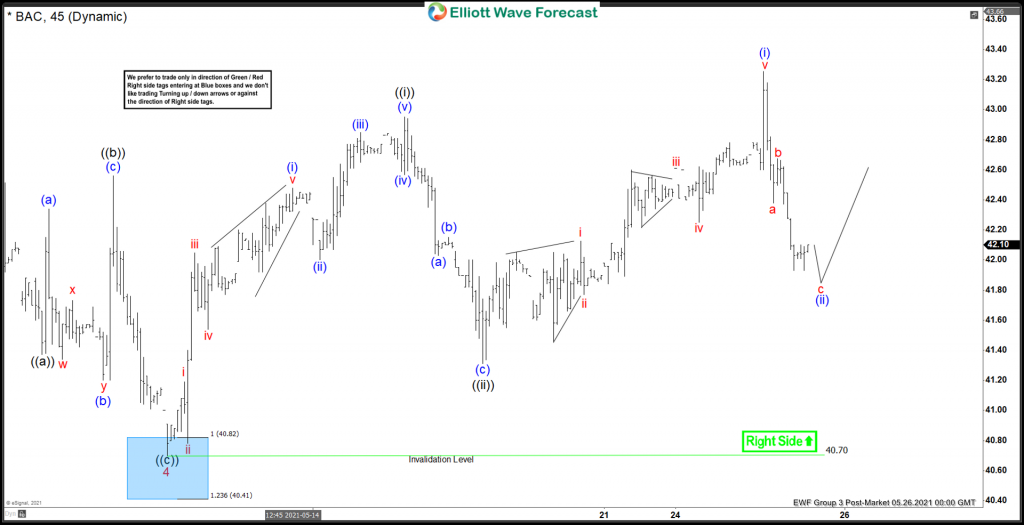
Here’s the latest 1hr chart from 5/26/2021 Post-Market update. The BAC is showing a strong reaction higher taking place from the blue box area after ending the zigzag correction within wave 4 at $40.70 low. Allowed members to create a risk-free position shortly after taking the long positions at the blue box area.

Premium

You have reached your limit of 3 free articles for this month.

Start your subscription and get access to all our original articles.

Subscribe to PremiumSign In

Author

Elliott Wave Forecast Team

Elliott Wave Forecast Team

ElliottWave-Forecast.com

More from Elliott Wave Forecast Team
Share:

Editor's Picks

EUR/USD clings to gains around 1.1800

EUR/USD manages to regain composure and retests the 1.1800 region in quite a positive start to the week. The pair’s bounce follows the US Dollar’s offered stance post-SCOTUS ruling ahead of important US data and Fedspeak on Tuesday.

GBP/USD looks stuck around 1.3500 amid firm gains

GBP/USD is pushing further north on Monday, revisiting the 1.3500 hurdle and beyond. Cable’s uptick is largely being fuelled by the broader softness in the Greenback, amid lingering uncertainty around tariffs.

Gold pops above $5,200, four-week highs

Gold is holding onto its bullish tone on Monday, reaching new multi-week highs just past the $5,200 mark per troy ounce. Fresh trade-war concerns, coupled with rising geopolitical tensions in the Middle East, are keeping demand for the yellow metal well on the rise.

Ethereum Price Forecast: BitMine's holdings reach 4.42 million ETH as Fundstrat predicts 87% win-ratio

Ethereum (ETH) treasury firm BitMine Immersion Technologies (BMNR) scooped up 51,162 ETH last week, marking its largest purchase since December.

Supreme Court nixes tariffs, Trump teases 15% global tariff

On February 20th, the Supreme Court ruled that Trump’s global tariffs under IEEPA authority were unconstitutional, effectively nullifying the framework. However, the relief was short-lived. Within hours, Trump floated a 15% blanket tariff under an alternative legal authority.

XRP recovers slightly as bearish sentiment dominates crypto market

Ripple is rising above $1.40 at the time of writing on Monday amid fresh tariff-triggered headwinds in the broader cryptocurrency market. The sell-off to $1.33, the token’s intraday low, can be attributed to macroeconomic uncertainty, geopolitical tensions and risk-averse sentiment among other factors.