Bank of America Corp. ($BAC) blue box area offers a buying opportunity

In today’s article, we’ll examine the recent performance of Bank of America Corp. ($BAC) through the lens of Elliott Wave Theory. We’ll review how the rally from the August 05, 2024, low unfolded as a 5-wave impulse and discuss our forecast for the next move. Let’s dive into the structure and expectations for this stock.
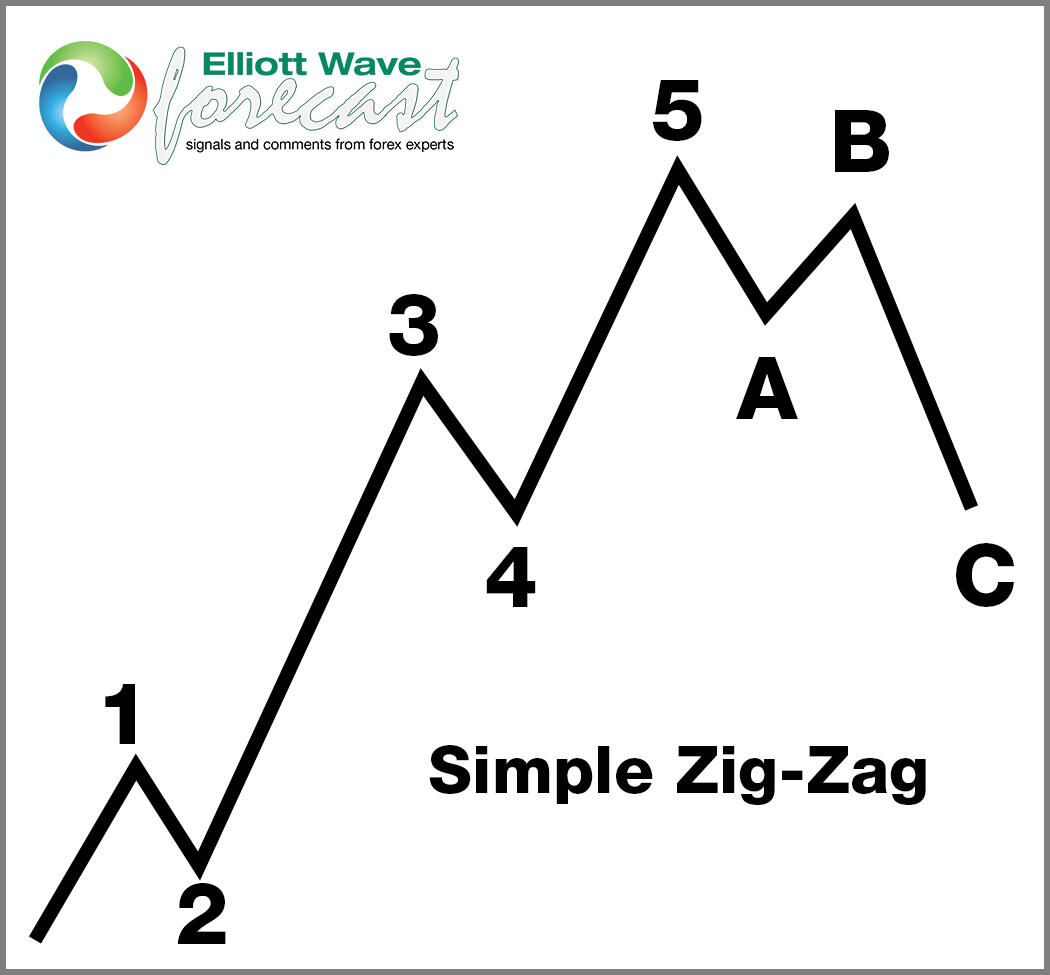
Five wave impulse structure + ABC correction
$BAC four-hour Elliott Wave chart 12.19.2024
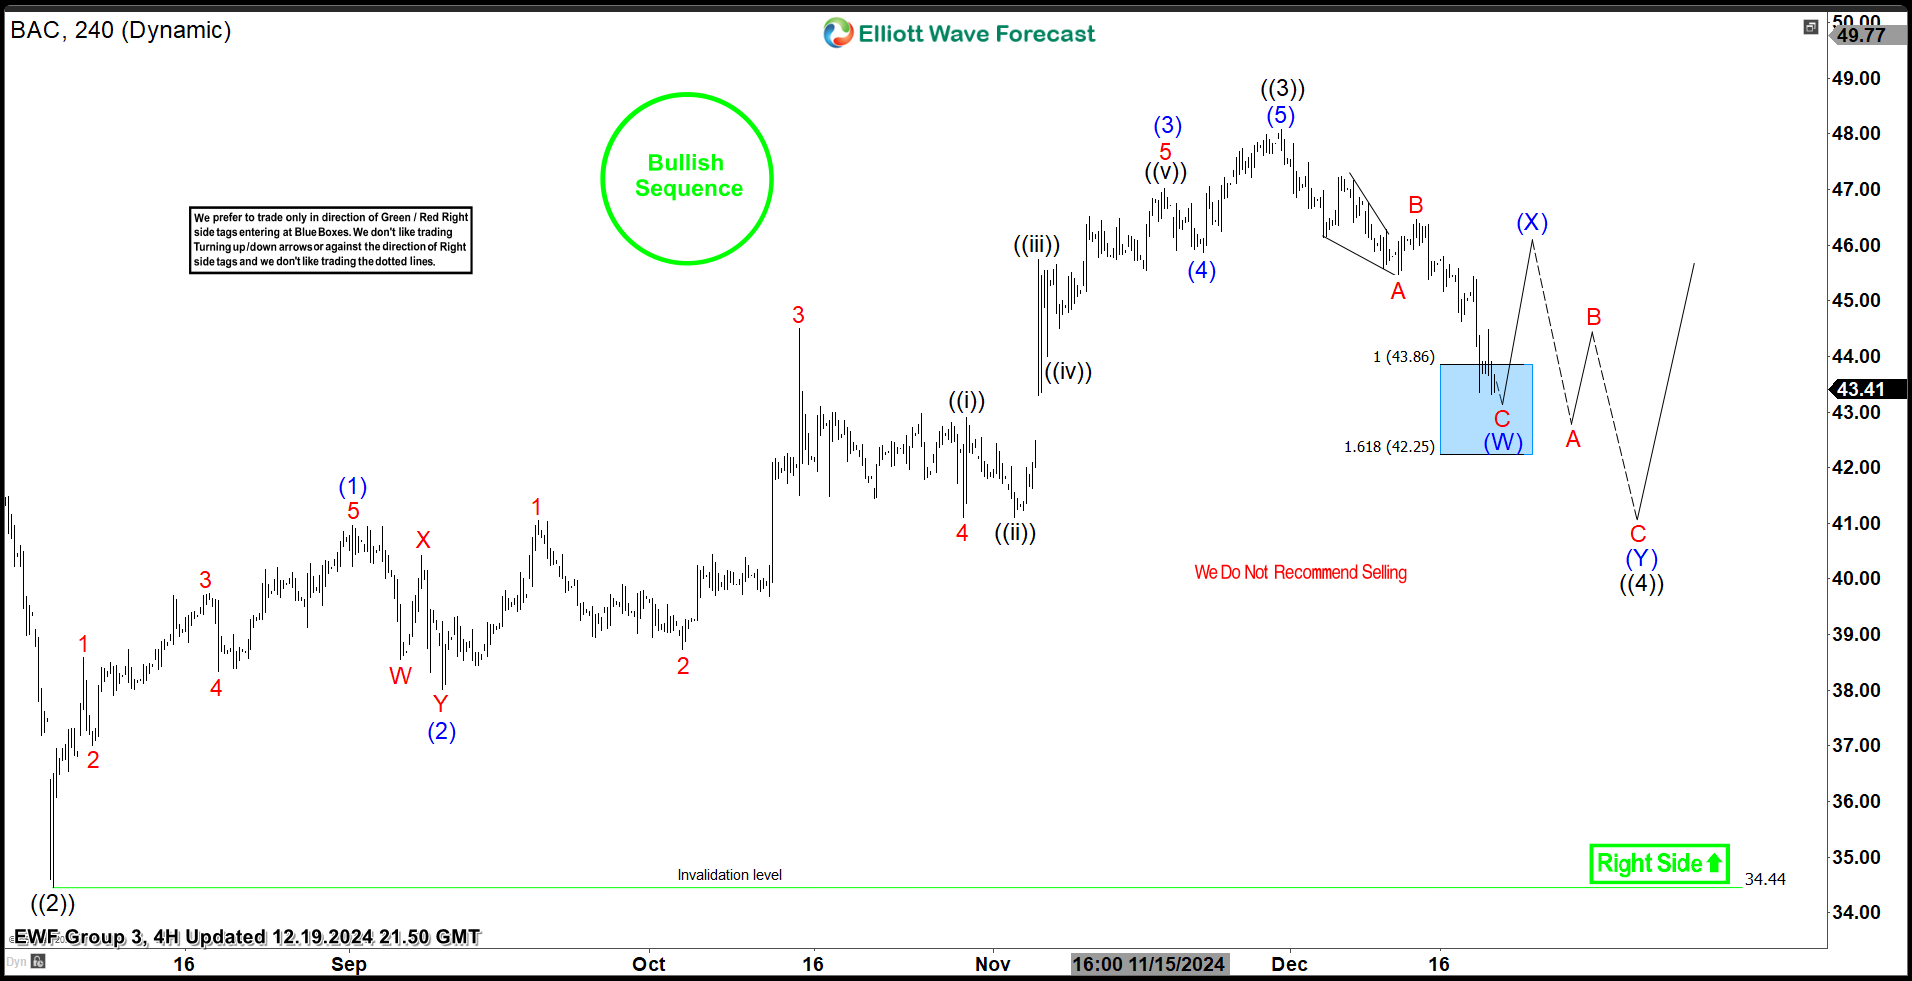
In the 4-hour Elliott Wave count from December 19, 2024, we see that $BAC completed a 5-wave impulsive cycle beginning on August 05, 2024, and ending on November 29, 2024, at the black ((3)). As expected, this initial wave prompted a pullback. We anticipated this pullback to unfold in 3 swings first, likely finding buyers in the equal legs area between $43.86 and $42.25.
This setup aligns with a typical Elliott Wave correction pattern (ABC), where the market pauses briefly before resuming the main trend.
$BAC four-hour Elliott Wave chart 12.22.2024
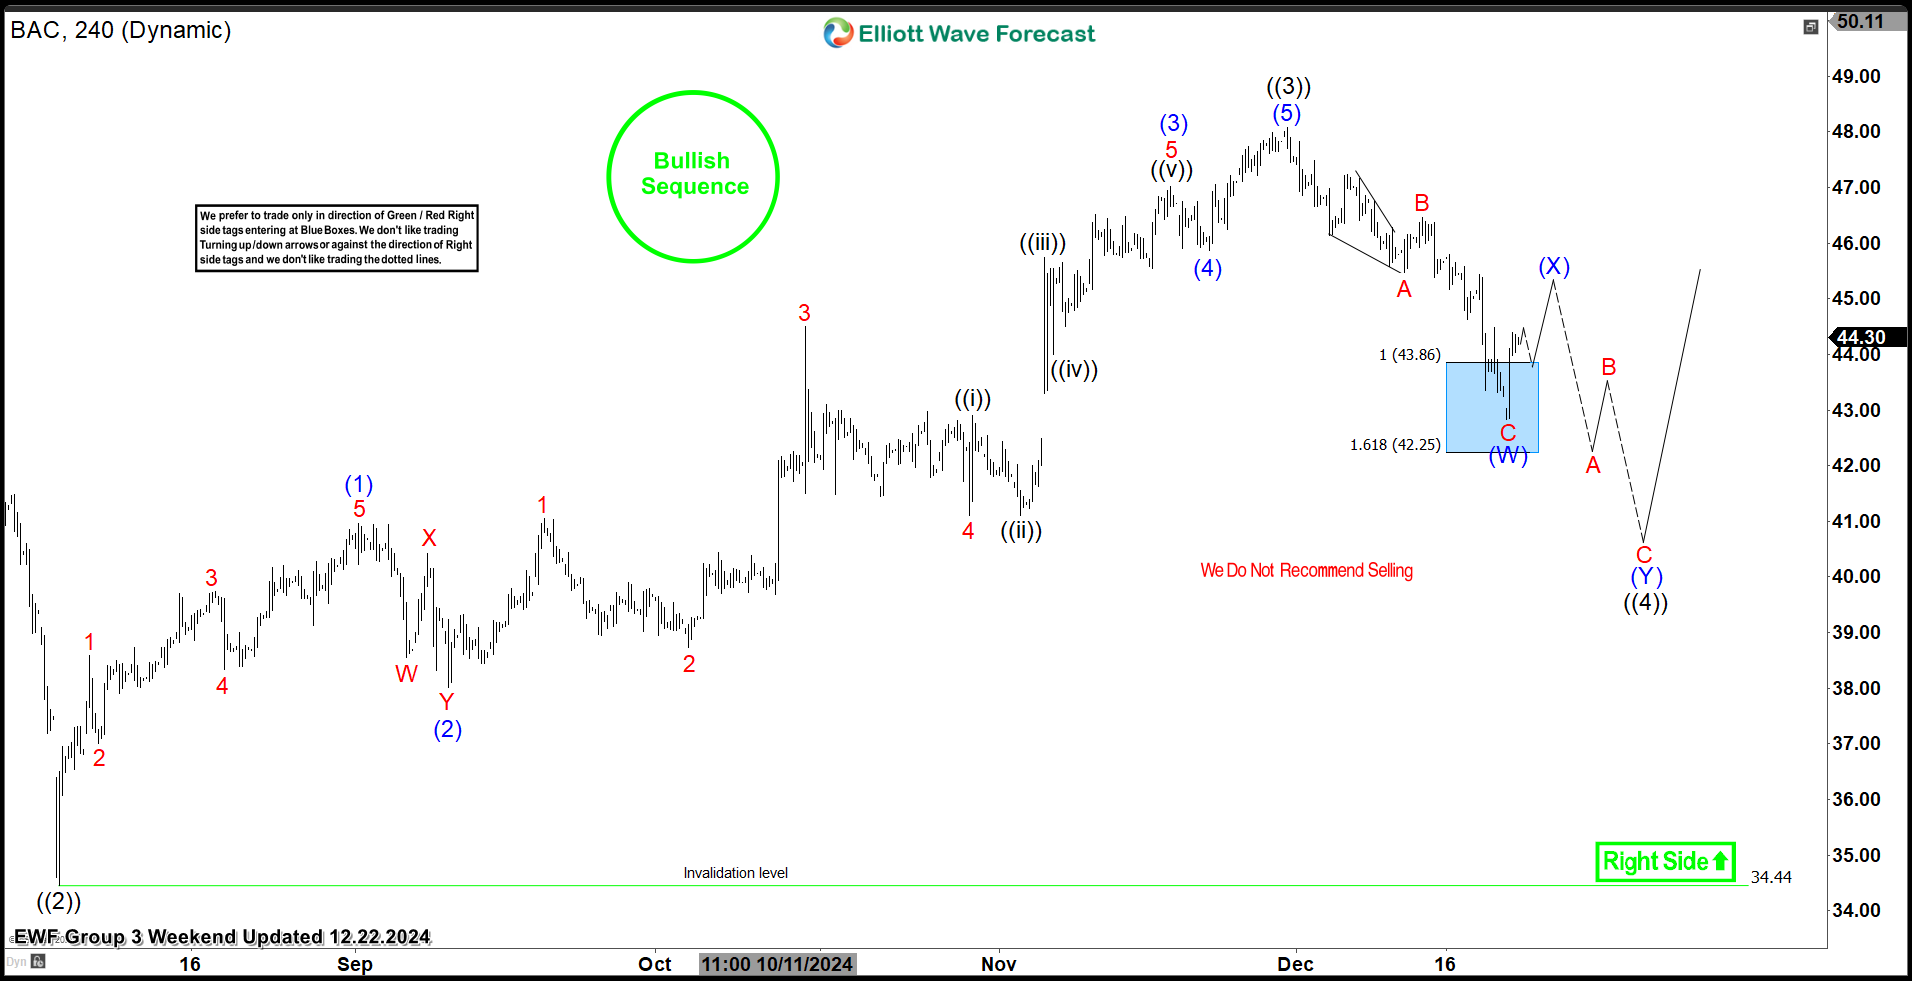
The most recent update, from December 22, 2024, shows that $BAC reacted as predicted. After the decline from the recent peak, the stock found support in the equal legs area, leading to a bounce. As a result, traders could adjust to go risk-free.
What’s next for $BAC?
With the current bounce, $BAC appears well-supported. Based on the Elliott Wave structure, we expect the stock to continue its upward trajectory, targeting the $45 – $46 range before another potential pullback. Therefore, it is essential to keep monitoring this zone as we approach it.
Conclusion
In conclusion, our Elliott Wave analysis of Bank of America Corp. ($BAC) suggests that it could bounce in the short term. Therefore, traders should monitor the $45 – $46 zone as the next target, keeping an eye out for any corrective pullbacks. By using Elliott Wave Theory, we can identify potential buying areas and enhance risk management in volatile markets.
Author

Elliott Wave Forecast Team
ElliottWave-Forecast.com