|

BABA: The nearest target for short positions is 49.00

The current chart of BABA shares hints at the construction of a bearish trend taking the form of a cycle triple zigzag w-x-y-x-z.

Chart

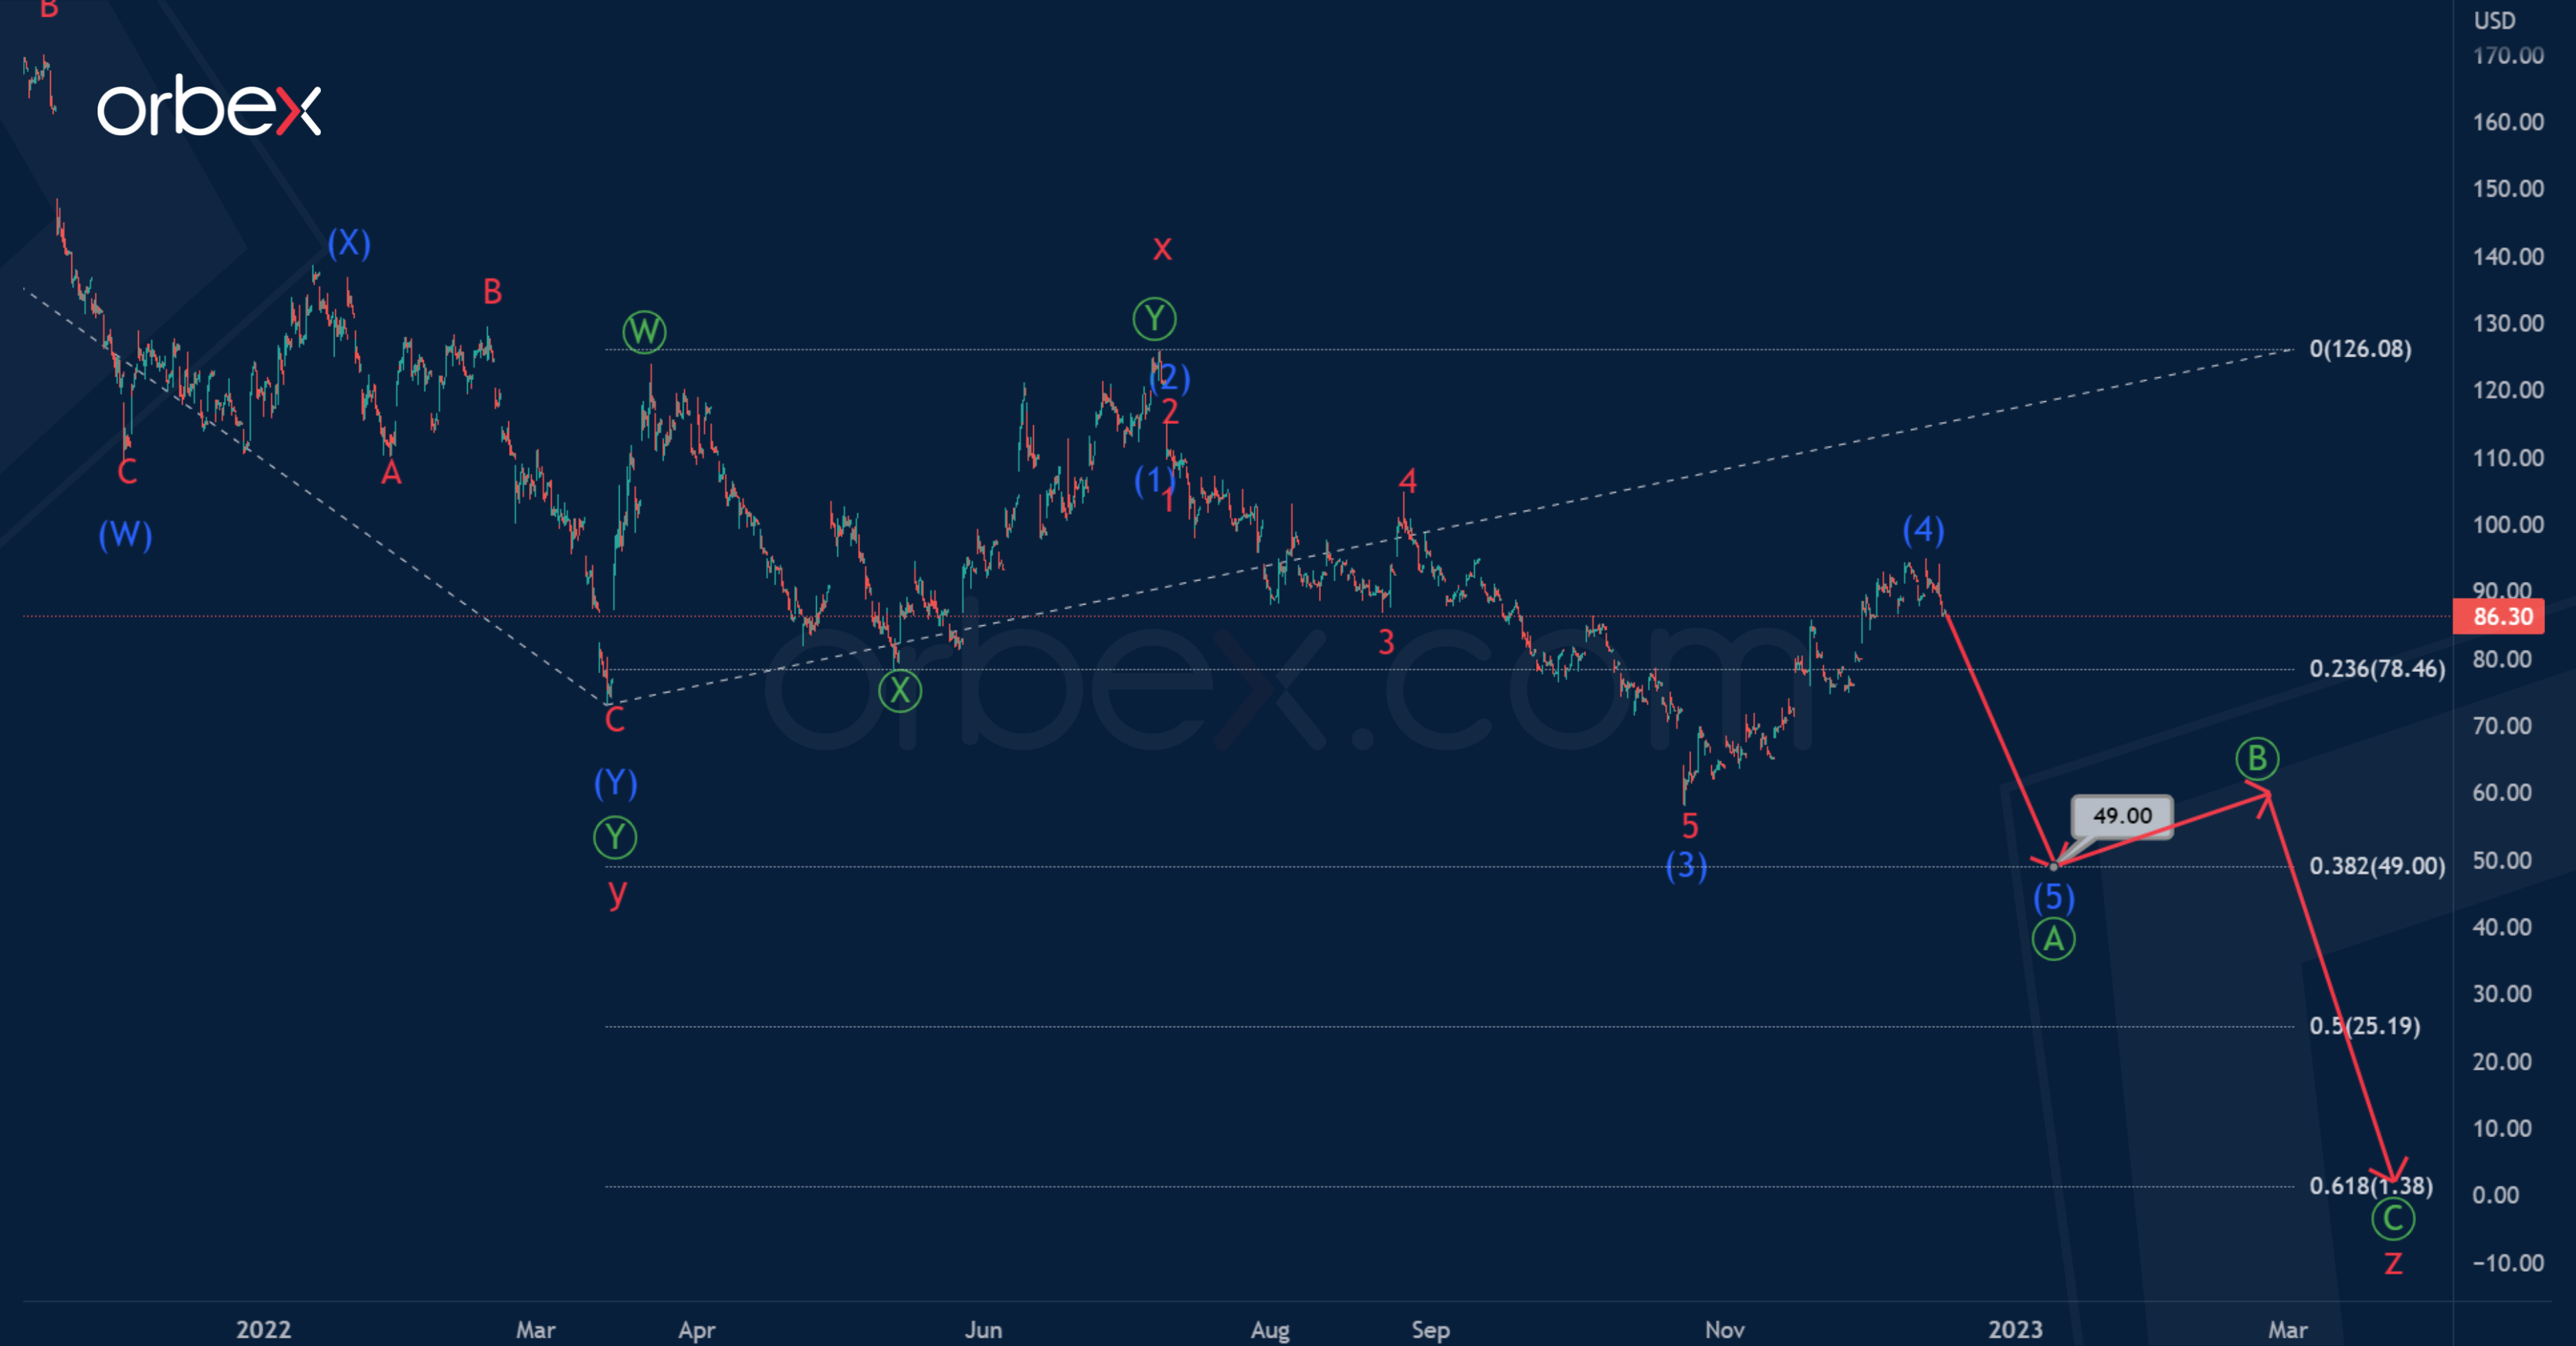
We see a completed actionary wave y, which has the form of a primary double zigzag Ⓦ-Ⓧ-Ⓨ, and a second small intervening wave x, also representing a double zigzag.

Now the formation of the final actionary wave z is taking place, which, most likely, will take the form of a primary standard zigzag Ⓐ-Ⓑ-Ⓒ.

The primary wave Ⓐ has the form of an impulse (1)-(2)-(3)-(4)-(5), for the completion of which a minor sub-wave 5 is needed. Its end is expected near 49.00. At that level, unfinished wave z will be at 38.2% of wave y. Then market participants can expect a small correction in the wave Ⓑ

Chart

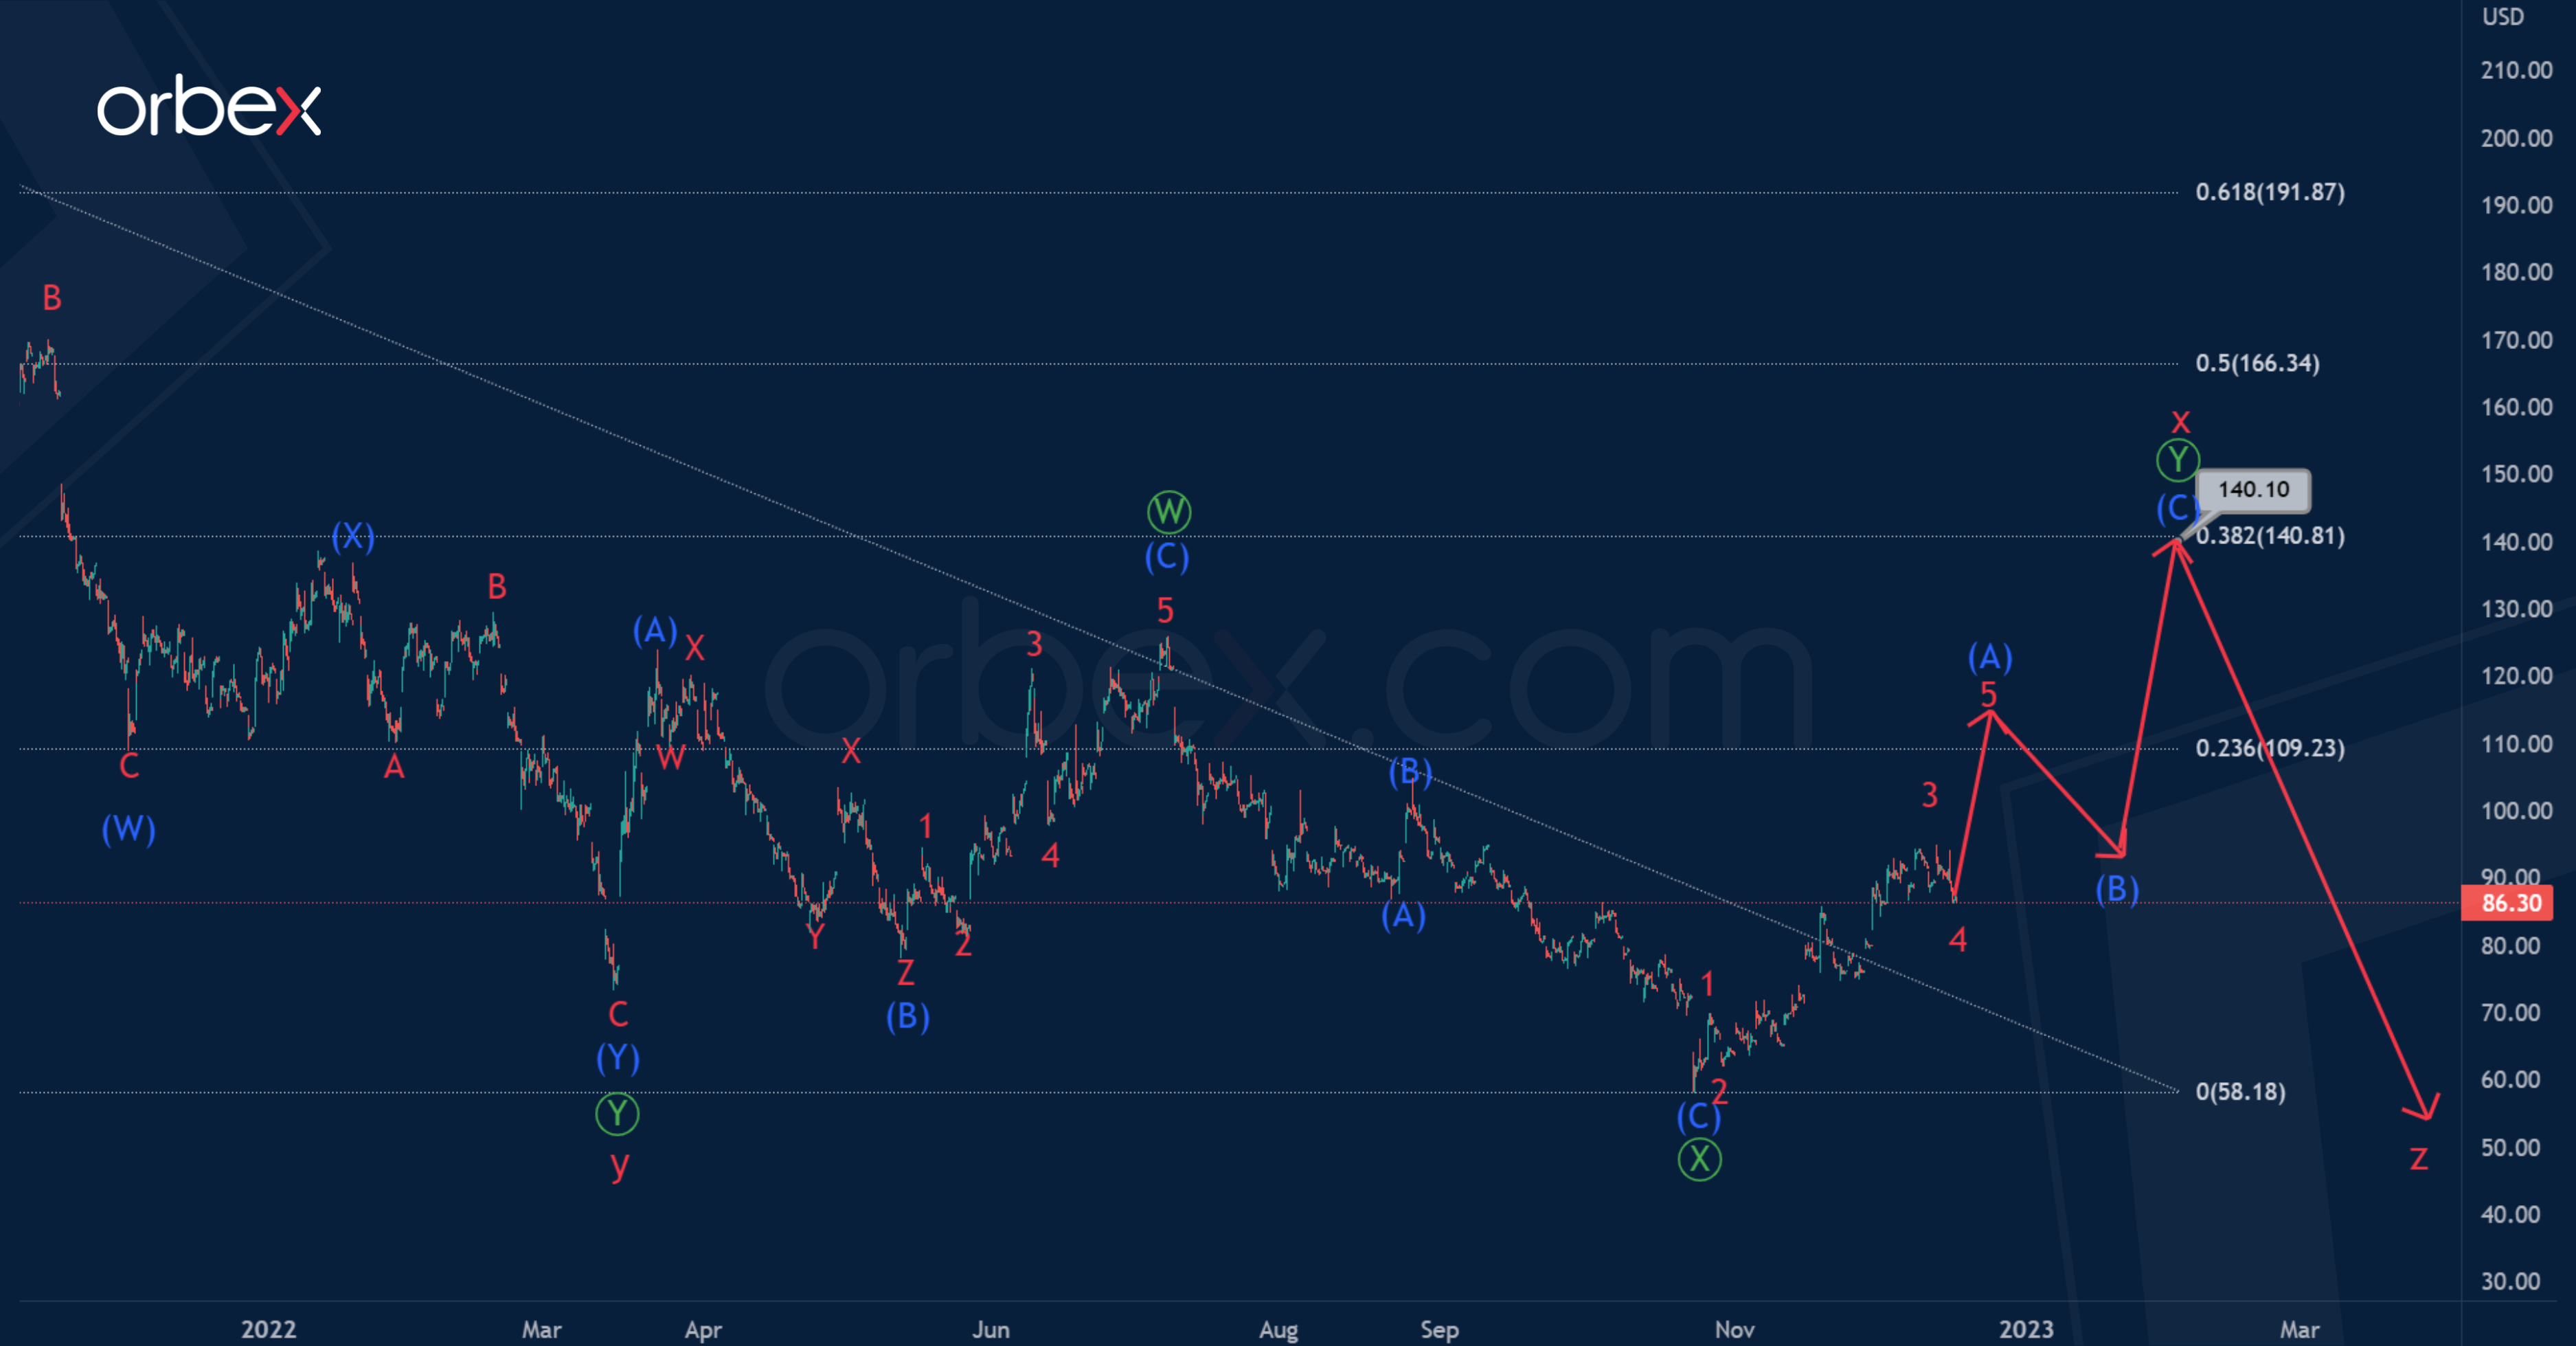
The second chart hints that the formation of the reactionary intervening wave is not completed. Here it will take the form of a double zigzag of the primary degree Ⓦ-Ⓧ-Ⓨ. The first two zigzag sub-waves Ⓦ-Ⓧ look finished.

Now the price is in the wave Ⓨ. It is assumed that this wave will take a standard zigzag structure of the intermediate degree (A)-(B)-(C), as shown in the chart.

The growth of shares should be expected to 140.10. At the level of 140.10, cycle intervening wave x will be at 38.2% of actionary wave y.

Author

Jing Ren

Jing-Ren has extensive experience in currency and commodities trading. He began his career in metal sales and trading at Societe Generale in London.

More from Jing Ren
Share:

Markets move fast. We move first.

Orange Juice Newsletter brings you expert driven insights - not headlines. Every day on your inbox.

By subscribing you agree to our Terms and conditions.

Editor's Picks

EUR/USD could test 1.1750 amid strengthening bullish bias

EUR/USD remains flat after two days of small losses, trading around 1.1740 during the Asian hours on Thursday. On the daily chart, technical analysis indicates a strengthening of a bullish bias, as the pair continues to trade within an ascending channel pattern.

GBP/USD consolidates above mid-1.3300s as traders await BoE and US CPI report

The GBP/USD pair struggles to capitalize on the overnight bounce from the 1.3310 area, or a one-week low, and oscillates in a narrow band during the Asian session on Thursday. Spot prices currently trade around the 1.3370 region, down less than 0.10% for the day, as traders opt to wait on the sidelines ahead of the key central bank event risk and US consumer inflation data.

Gold awaits weekly trading range breakout ahead of US CPI report

Gold struggles to capitalize on the previous day's move higher back closer to the $4,350 level and trades with a mild negative bias during the Asian session on Thursday. The downtick could be attributed to some profit-taking amid a US Dollar uptick, though it is likely to remain cushioned on the back of a supportive fundamental backdrop. 

Dogecoin breaks key support amid declining investor confidence

Dogecoin trades in the red on Thursday, following a 4% decline on the previous day. The DOGE supply in profit declines as large wallet investors trim their portfolios. Derivatives data shows a surge in bearish positions amid declining retail interest.

Monetary policy: Three central banks, three decisions, the same caution

While the Fed eased its monetary policy on 10 December for the third consecutive FOMC meeting, without making any guarantees about future action, the BoE, the ECB and the BoJ are holding their respective meetings this week. 

Dogecoin Price Forecast: DOGE breaks key support amid declining investor confidence

Dogecoin (DOGE) trades in the red on Thursday, following a 4% decline on the previous day. The DOGE supply in profit declines as large wallet investors trim their portfolios. Derivatives data shows a surge in bearish positions amid declining retail interest.