Axis Bank LTD Indian stocks Elliott Wave technical analysis [Video]
![Axis Bank LTD Indian stocks Elliott Wave technical analysis [Video]](https://editorial.fxstreet.com/images/Markets/Equities/Industries/Utilities/pic-air-pipes_XtraLarge.jpg)
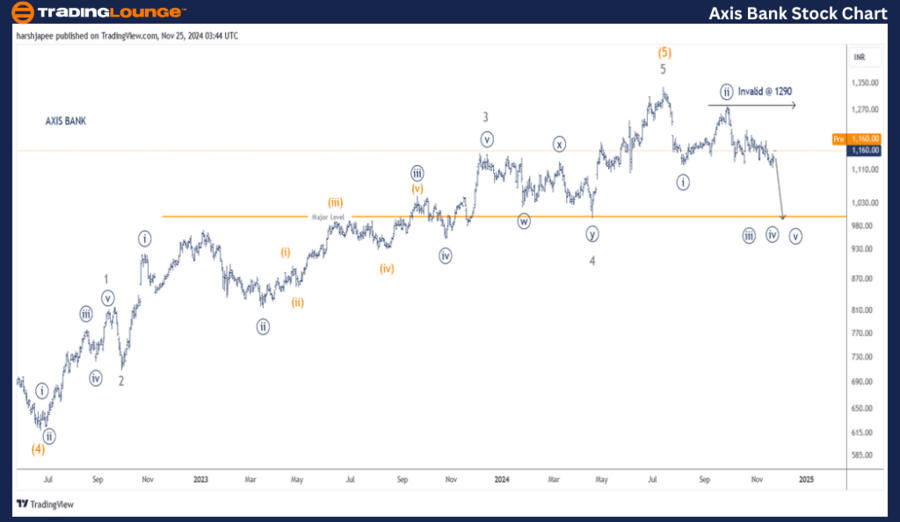
AxisBank (1D Chart) Elliott Wave technical analysis
Function: Counter Trend (Minor degree, Grey. Wave A unfolding).
Mode: Corrective.
Structure: Potential Impulse.
Position: Minute Wave ((ii)) Navy of 1/A complete.
Details: Minute Wave ((iii)) Navy is now underway towards 1000 at least, against 1290.
Invalidation point: 1290, risk tightened.
AXISBANK Daily Chart Technical Analysis and potential Elliott Wave Counts:
AXISBANK daily chart is indicating a potential turn lower after having hit 1340 high, terminating Intermediate Wave (5) Orange. The stock might have terminated its religious uptrend and turned lower against 1340 mark.
The stock had terminated its Intermediate Wave (4) Orange around 620 mark in June 2022. Since then, we can observe a clear five wave rally Minor Waves 1 through 5, terminating around 1340 levels. If the above is correct, potential trend has now turned lower towards 1000 mark.
Furthermore, Minute Waves ((i)) and ((ii)) seem to be complete around 1130 and 1290 levels respectively. If the above holds, Minute Wave ((iii)) is now progressing against 1290 high.
AxisBank (4H Chart) Elliott Wave technical analysis
Function: Counter Trend (Minor degree, Grey. Wave A unfolding).
Mode: Corrective.
Structure: Potential Impulse.
Position: Minute Wave ((ii)) Navy of 1/A complete.
Details: Minute Wave ((iii)) Navy is now underway towards 1000 at least, against 1290.
Invalidation point: 1290, risk tightened.
AXISBANK 4H Chart Technical Analysis and potential Elliott Wave Counts.
AXISBANK 4H chart highlights the sub waves after Minor Wave 3 terminated around 1154 high in December 2023. Minor Wave 4 was a combination, followed by an impulse Wave 5 towards 1340 mark. The stock seems to have turned lower since then and is unfolding an impulse at Minute Degree against 1290 high.
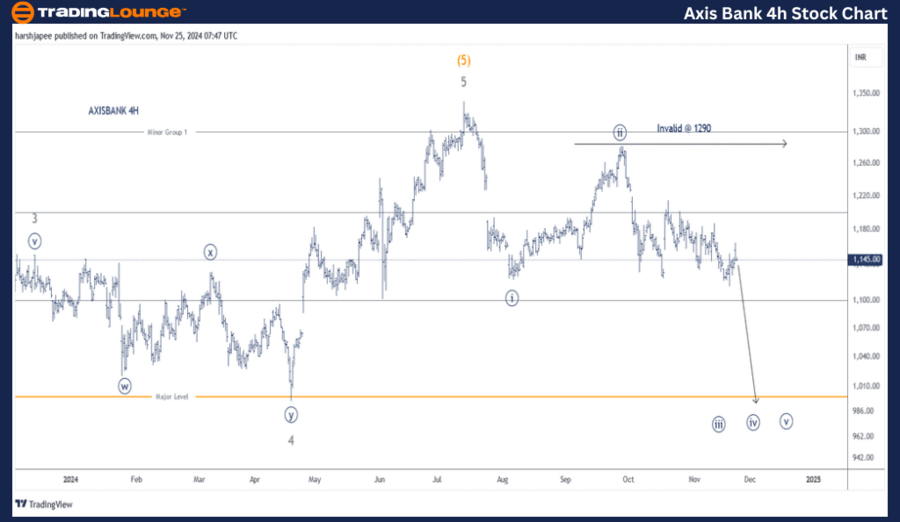
Conclusion
AXISBANK is progressing within Minute Wave ((iii)) against 1290 high.
Elliott Wave Analyst: Harsh Japee
AxisBank Elliott Wave technical analysis [Video]
Author

Peter Mathers
TradingLounge
Peter Mathers started actively trading in 1982. He began his career at Hoei and Shoin, a Japanese futures trading company.


