Australian Dollar weakens as US Dollar strengthens ahead of the US CPI inflation release
- The Australian Dollar is struggling amid broad risk aversion and ongoing economic concerns in China.
- Australia’s strong economic data last week lowered expectations of further rate cuts by the Reserve Bank of Australia.
- Traders adopt caution ahead of US Consumer Price Index data release on Wednesday.

The Australian Dollar (AUD) weakens against the US Dollar (USD) on Wednesday, weighed down by broad risk aversion. Concerns intensified due to policy shifts by US President Donald Trump, particularly tariffs that increased the likelihood of a prolonged trade war.
Australian Prime Minister Anthony Albanese stated on Wednesday that “Australia will not impose reciprocal tariffs on the United States (US)” as “retaliatory measures would only raise costs for Australian consumers and drive inflation. His remarks follow Trump's decision to implement a 25% tariff on all imported steel and aluminum.
The AUD also faces pressure from ongoing economic uncertainties and persistent deflationary risks in China, Australia’s largest trading partner, as traders await key policy announcements from Beijing.
Market participants remain focused on the Reserve Bank of Australia’s (RBA) policy outlook, especially after last week’s strong economic data reduced expectations of further rate cuts. Economic growth surpassed forecasts, marking its first acceleration in over a year.
The latest RBA Meeting Minutes signal a cautious stance on monetary policy, emphasizing that February’s rate cut does not indicate a commitment to continued easing.
Investors are now turning their attention to February’s US Consumer Price Index (CPI) release on Wednesday for further insights into inflation trends.
With the Federal Reserve in its blackout period ahead of the March 19 meeting, central bank commentary will be scarce this week.
Australian Dollar struggles as escalating global trade tensions weigh on market sentiment
- The US Dollar Index (DXY), which tracks the US Dollar against six major currencies, inches higher and is hovering around 103.50 at the time of writing. However, the Greenback faced challenges due to the likelihood of a US economic slowdown.
- President Trump reversed his decision to double tariffs on Canadian steel and aluminum to 50%, a move he announced late Tuesday. However, the White House confirmed to Reuters that new 25% tariffs on all imported steel and aluminum will still take effect on Wednesday, impacting allies and key US suppliers, including Canada and Mexico.
- Trump characterized the economy as being in a "transition period," hinting at a potential slowdown. Investors took his remarks as an early signal of possible economic turbulence in the near future.
- Last week, Fed Chair Jerome Powell reassured markets that the central bank sees no immediate need to adjust monetary policy despite rising uncertainties. San Francisco Fed President Mary Daly echoed this sentiment, noting that increasing business uncertainty could dampen demand but does not justify an interest rate change.
- RBA Deputy Governor Andrew Hauser highlighted that global trade uncertainty is at a 50-year high. Hauser warned that uncertainty stemming from US President Donald Trump's tariffs could prompt businesses and households to delay planning and investment, potentially weighing on economic growth.
- Bloomberg reported on Tuesday, citing sources familiar with the matter, that trade and other negotiations between the US and China remain at a deadlock. Chinese officials state that the US has not provided clear steps regarding fentanyl measures needed for tariff relief. Meanwhile, a source familiar with White House discussions indicated that no plans are currently underway for an in-person meeting between the two leaders.
- China announced on Saturday that it will impose a 100% tariff on Canadian rapeseed oil, oil cakes, and peas, along with a 25% levy on aquatic products and pork from Canada. The move comes in retaliation for tariffs introduced by Canada in October, escalating trade tensions. This marks a new front in a broader trade conflict driven by US President Donald Trump's tariff policies. The tariffs are set to take effect on March 20.
Technical Analysis: Australian Dollar tests nine-day barrier near 0.6300
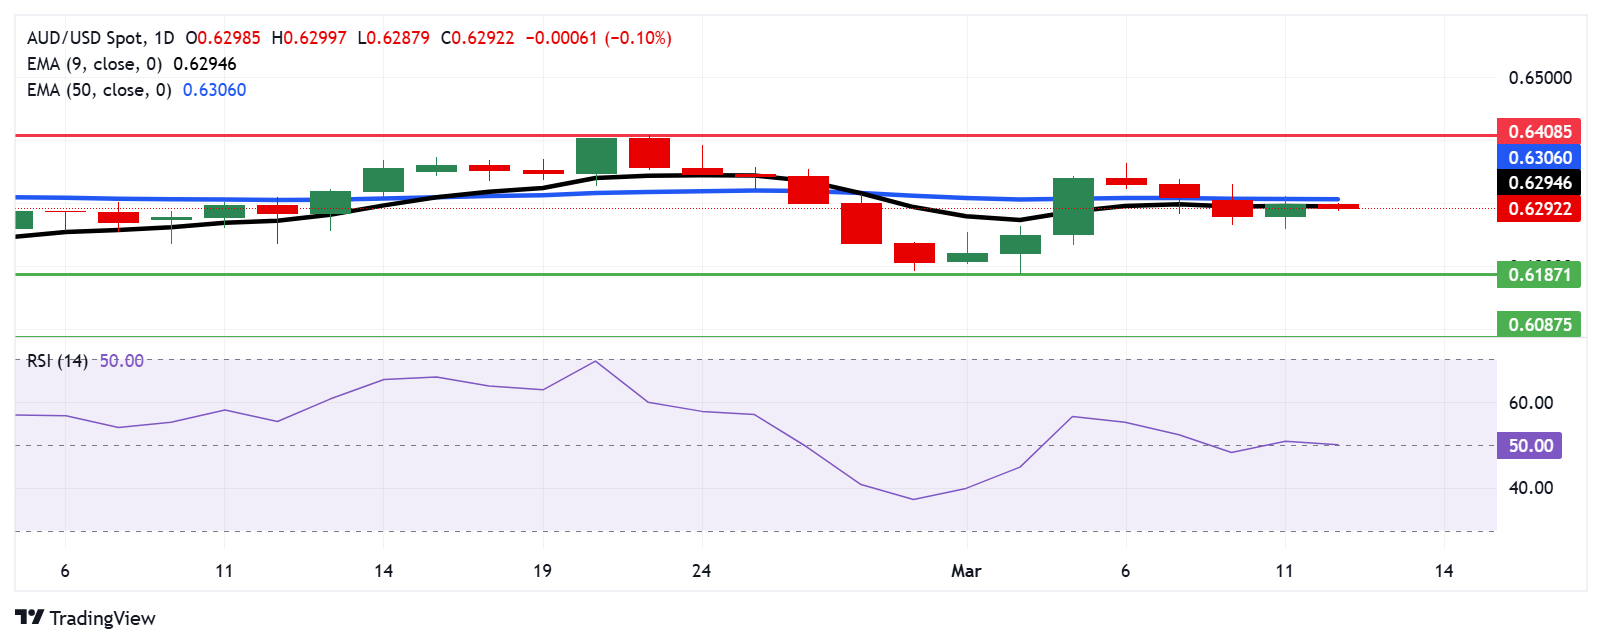
The AUD/USD pair is trading near 0.6290 on Wednesday, with technical analysis of the daily chart showing the pair remaining below the nine-day Exponential Moving Average (EMA), signaling weakening short-term momentum. Additionally, the 14-day Relative Strength Index (RSI) is hovering slightly below 50, reinforcing a bearish bias.
On the downside, the AUD/USD pair could navigate the region around the five-week low of 0.6187, recorded on March 5.
The AUD/USD pair tests immediate resistance at a nine-day EMA of 0.6294, followed by the 50-day EMA at 0.6306. A break above this level could strengthen short-term momentum, potentially pushing the pair toward the three-month high of 0.6408, last reached on February 21.
AUD/USD: Daily Chart
Australian Dollar PRICE Today
The table below shows the percentage change of Australian Dollar (AUD) against listed major currencies today. Australian Dollar was the weakest against the US Dollar.
| USD | EUR | GBP | JPY | CAD | AUD | NZD | CHF | |
|---|---|---|---|---|---|---|---|---|
| USD | 0.19% | 0.20% | 0.21% | 0.09% | 0.21% | 0.25% | 0.11% | |
| EUR | -0.19% | 0.00% | -0.02% | -0.10% | 0.00% | 0.05% | -0.09% | |
| GBP | -0.20% | -0.00% | 0.00% | -0.10% | 0.00% | 0.05% | -0.09% | |
| JPY | -0.21% | 0.02% | 0.00% | -0.12% | 0.00% | 0.03% | -0.08% | |
| CAD | -0.09% | 0.10% | 0.10% | 0.12% | 0.12% | 0.16% | 0.03% | |
| AUD | -0.21% | -0.01% | -0.01% | -0.01% | -0.12% | 0.04% | -0.08% | |
| NZD | -0.25% | -0.05% | -0.05% | -0.03% | -0.16% | -0.04% | -0.13% | |
| CHF | -0.11% | 0.09% | 0.09% | 0.08% | -0.03% | 0.08% | 0.13% |
The heat map shows percentage changes of major currencies against each other. The base currency is picked from the left column, while the quote currency is picked from the top row. For example, if you pick the Australian Dollar from the left column and move along the horizontal line to the US Dollar, the percentage change displayed in the box will represent AUD (base)/USD (quote).
Economic Indicator
Consumer Price Index (YoY)
Inflationary or deflationary tendencies are measured by periodically summing the prices of a basket of representative goods and services and presenting the data as The Consumer Price Index (CPI). CPI data is compiled on a monthly basis and released by the US Department of Labor Statistics. The YoY reading compares the prices of goods in the reference month to the same month a year earlier.The CPI is a key indicator to measure inflation and changes in purchasing trends. Generally speaking, a high reading is seen as bullish for the US Dollar (USD), while a low reading is seen as bearish.
Read more.Next release: Wed Mar 12, 2025 12:30
Frequency: Monthly
Consensus: 2.9%
Previous: 3%
Source: US Bureau of Labor Statistics
The US Federal Reserve has a dual mandate of maintaining price stability and maximum employment. According to such mandate, inflation should be at around 2% YoY and has become the weakest pillar of the central bank’s directive ever since the world suffered a pandemic, which extends to these days. Price pressures keep rising amid supply-chain issues and bottlenecks, with the Consumer Price Index (CPI) hanging at multi-decade highs. The Fed has already taken measures to tame inflation and is expected to maintain an aggressive stance in the foreseeable future.
Author

Akhtar Faruqui
FXStreet
Akhtar Faruqui is a Forex Analyst based in New Delhi, India. With a keen eye for market trends and a passion for dissecting complex financial dynamics, he is dedicated to delivering accurate and insightful Forex news and analysis.