Australian Dollar holds gains as US Dollar remains subdued ahead of US-China trade talks
- The Australian Dollar holds ground following mixed economic data from China released on Monday.
- China’s Consumer Price Index declined by 0.1% in May, against the expected 0.2% drop.
- US Treasury Secretary Scott Bessent, along with two other officials, is set to meet with Chinese officials in London.

The Australian Dollar (AUD) edges higher against the US Dollar on Monday, recovering its losses from the previous session. The AUD/USD pair remains stronger following the release of China’s key economic data. Any economic update from China could impact AUD as China and Australia are close trade partners.
The National Bureau of Statistics of China reported that the Consumer Price Index (CPI) dropped at an annual pace of 0.1% in May, following April’s 0.1% decline. However, the market consensus was for a 0.2% decrease in the reported period. Meanwhile, China’s CPI inflation declined by 0.2% MoM, against April’s 0.1% increase. China’s Producer Price Index (PPI) continues to weaken with an annual decline of 3.3% in May, following a 2.7% decline in April.
China's Trade Balance (CNY) arrived at CNY743.56 billion in May, expanding from the previous surplus of CNY689.99 billion. Meanwhile, Exports rose 6.3% YoY against 9.3% in April. The country’s imports fell 2.1% YoY in the same period, from a 0.8% rise recorded previously.
Traders would likely assess renewed US-China trade negotiations as President Donald Trump and China’s Xi Jinping agreed on Thursday that both sides’ officials would soon resume trade negotiations aimed at ending the trade war. US Treasury Secretary Scott Bessent and two other Trump administration officials are set to meet with Chinese officials in London on Monday.
Reserve Bank of Australia (RBA) Assistant Governor Sarah Hunter cautioned that “higher US tariffs will put a drag on the global economy,” and warned that higher uncertainty could dampen investment, output, and employment in Australia.
Australian Dollar rises as US Dollar corrects downward
- The US Dollar Index (DXY), which measures the value of the US Dollar against six major currencies, is trading lower at around 99.00 at the time of writing. However, the Greenback received support from stronger-than-expected US jobs data for May, released on Friday.
- The US Bureau of Labor Statistics (BLS) reported that US Nonfarm Payrolls (NFP) rose by 139,000 in May compared to the 147,000 increase (revised from 177,000) in April. This reading came in above the market consensus of 130,000. Moreover, the Unemployment Rate held steady at 4.2%, and the Average Hourly Earnings remained unchanged at 3.9%, both readings came in stronger than the market expectation.
- The stronger-than-expected US jobs data raised the odds of the Federal Reserve (Fed) keeping its benchmark interest rate steady at its next two monetary policy meetings.
- US President Donald Trump called upon, in a post published on Truth Social on Wednesday, Federal Reserve (Fed) Chairman Jerome Powell to lower the policy rate. "ADP NUMBER OUT!!! “Too Late” Powell must now LOWER THE RATE. He is unbelievable!!! Europe has lowered NINE TIMES," Trump said.
- On Wednesday, Minneapolis Fed President Neel Kashkari noted that the labor market is showing some signs of slowing down. However, persistent uncertainty prevails over the economy, and the Fed must stay in wait-and-see mode to assess how the economy responds to the uncertainty.
- House Republicans passed Trump’s “Big Beautiful Bill,” a multitrillion-dollar tax and spending package, which could increase the US fiscal deficit, along with the risk of bond yields staying higher for longer. This scenario raises concerns over the US economy and prompts traders to sell American assets under the “Sell America” trend. Policy experts anticipate Senate changes as GOP lawmakers aim to finalize the “big bill” by July 4.
- Australia’s Trade Balance posted a 5,413M surplus month-over-month in April, below the 6,100M expected and 6,892M (revised from 6,900M) in the previous reading. Exports declined by 2.4% MoM in April, against a 7.2% rise prior (revised from 7.6%). Meanwhile, Imports rose by 1.1%, compared to a decline of 2.4% (revised from -2.2%) seen in March. China’s Caixin Services PMI rose to 51.1 in May as expected, from 50.7 in April.
- The Australian Bureau of Statistics (ABS) showed that Gross Domestic Product (GDP) grew by 0.2% quarter-over-quarter in Q1, declining from the previous 0.6% growth. Australia’s economy fell short of the expected 0.4% rise. Meanwhile, the annual GDP growth rate remained consistent at 1.3%, below the expected 1.5%.
Australian Dollar advances above 0.6500 toward seven-month highs
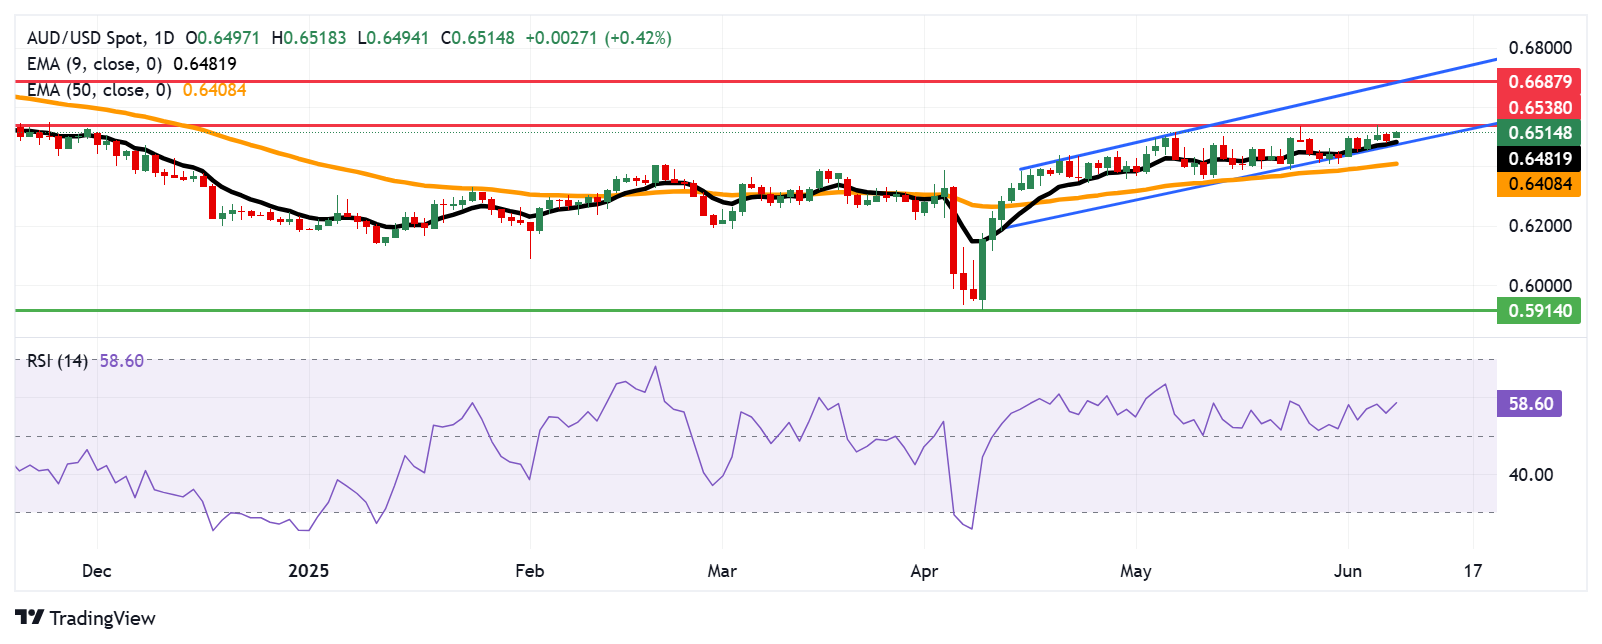
AUD/USD is trading around 0.6510 on Monday. The technical analysis of the daily chart indicates a persistent bullish bias as the pair remains within the ascending channel pattern. Additionally, the pair stays above the nine-day Exponential Moving Average (EMA), which indicates the short-term price momentum is stronger. The 14-day Relative Strength Index (RSI) is also positioned above the 50 mark, suggesting a bullish outlook.
The AUD/USD pair may find an immediate barrier at a seven-month high of 0.6538, reached on June 5. The break above this level could prompt the pair to explore the region around the upper boundary of the ascending channel around 0.6680, aligned with the eight-month high at 0.6687.
On the downside, the primary support appears at the nine-day EMA of 0.6481, aligned with the ascending channel’s lower boundary around 0.6480. A breach below this crucial support zone could weaken the bullish bias and lead the AUD/USD pair to test the 50-day EMA at 0.6408.
AUD/USD: Daily Chart
Australian Dollar PRICE Today
The table below shows the percentage change of Australian Dollar (AUD) against listed major currencies today. Australian Dollar was the strongest against the US Dollar.
| USD | EUR | GBP | JPY | CAD | AUD | NZD | CHF | |
|---|---|---|---|---|---|---|---|---|
| USD | -0.23% | -0.24% | -0.39% | -0.06% | -0.24% | -0.35% | -0.14% | |
| EUR | 0.23% | -0.04% | -0.20% | 0.15% | -0.00% | -0.14% | 0.07% | |
| GBP | 0.24% | 0.04% | -0.08% | 0.18% | 0.04% | -0.10% | 0.11% | |
| JPY | 0.39% | 0.20% | 0.08% | 0.34% | 0.11% | -0.01% | 0.15% | |
| CAD | 0.06% | -0.15% | -0.18% | -0.34% | -0.20% | -0.29% | -0.08% | |
| AUD | 0.24% | 0.00% | -0.04% | -0.11% | 0.20% | -0.14% | 0.07% | |
| NZD | 0.35% | 0.14% | 0.10% | 0.00% | 0.29% | 0.14% | 0.21% | |
| CHF | 0.14% | -0.07% | -0.11% | -0.15% | 0.08% | -0.07% | -0.21% |
The heat map shows percentage changes of major currencies against each other. The base currency is picked from the left column, while the quote currency is picked from the top row. For example, if you pick the Australian Dollar from the left column and move along the horizontal line to the US Dollar, the percentage change displayed in the box will represent AUD (base)/USD (quote).
US-China Trade War FAQs
Generally speaking, a trade war is an economic conflict between two or more countries due to extreme protectionism on one end. It implies the creation of trade barriers, such as tariffs, which result in counter-barriers, escalating import costs, and hence the cost of living.
An economic conflict between the United States (US) and China began early in 2018, when President Donald Trump set trade barriers on China, claiming unfair commercial practices and intellectual property theft from the Asian giant. China took retaliatory action, imposing tariffs on multiple US goods, such as automobiles and soybeans. Tensions escalated until the two countries signed the US-China Phase One trade deal in January 2020. The agreement required structural reforms and other changes to China’s economic and trade regime and pretended to restore stability and trust between the two nations. However, the Coronavirus pandemic took the focus out of the conflict. Yet, it is worth mentioning that President Joe Biden, who took office after Trump, kept tariffs in place and even added some additional levies.
The return of Donald Trump to the White House as the 47th US President has sparked a fresh wave of tensions between the two countries. During the 2024 election campaign, Trump pledged to impose 60% tariffs on China once he returned to office, which he did on January 20, 2025. With Trump back, the US-China trade war is meant to resume where it was left, with tit-for-tat policies affecting the global economic landscape amid disruptions in global supply chains, resulting in a reduction in spending, particularly investment, and directly feeding into the Consumer Price Index inflation.
Author

Akhtar Faruqui
FXStreet
Akhtar Faruqui is a Forex Analyst based in New Delhi, India. With a keen eye for market trends and a passion for dissecting complex financial dynamics, he is dedicated to delivering accurate and insightful Forex news and analysis.