Australian Dollar remains stronger despite increased risk aversion, US NFP eyed
- The Australian Dollar appreciates after the release of higher Producer Price Index figures.
- Australia's PPI rose by 4.8% YoY in Q2, against the previous quarter’s reading of 4.3%.
- The US Dollar received support due to increased risk aversion amid raised concerns about the US economy.

The Australian Dollar (AUD) recovers its daily losses against the US Dollar (US) following the higher Producer Price Index (PPI) data released on Friday. However, this upside could be limited due to increased risk aversion ahead of upcoming US labor market data, including the Nonfarm Payrolls report for July.
The Aussie Dollar faces challenges as second-quarter inflation data has diminished expectations for another rate hike by the Reserve Bank of Australia (RBA) at its policy meeting next week. Markets now estimate about a 50% chance of an RBA rate cut in November, a move anticipated much earlier than previously forecasted for April next year. These factors are contributing to the downward pressure on the Australian Dollar.
Recent manufacturing and employment data have raised concerns about the US economy, boosting risk aversion and supporting the US Dollar. Markets are grappling with a delicate balancing act, as an economic downturn heightens expectations for a rate cut by the Federal Reserve. The CME's FedWatch Tool indicates that traders are fully pricing in a 25 basis point rate cut on September 18, with a one-in-five chance of a 50 basis point cut.
Daily Digest Market Movers: Australian Dollar advances following PPI data
- US ISM Manufacturing Purchasing Managers Index (PMI) tumbled to an eight-month low of 46.8 in July, compared to the previous 48.5 reading and the forecasted move up to 48.8.
- US Initial Jobless Claims for the week ended July 26 rose to 249K from the previous week’s 235K, lurching past the forecast uptick to 236K.
- China’s Caixin Manufacturing Purchasing Managers Index (PMI) posted a reading of 49.8 for July, falling short of the expected reading of 51.5 and the previous reading of 51.8. Since both nations are close trade partners, changes in the Chinese economy can significantly impact the Australian market.
- The Australian Bureau of Statistics (ABS) reported a trade surplus of 5,589 million for June, surpassing the anticipated 5,000 million but still below the previous reading of 5,773 million.
- During a press conference, Federal Reserve Chair Jerome Powell stated that a rate cut in September is "on the table." Powell added that the central bank will closely monitor the labor market and remain vigilant for signs of a potential sharp downturn, per Reuters.
- The ABS reported on Wednesday that the Monthly CPI rose by 3.8% in the year to June, easing from the 4% posted in May. The quarterly CPI rose 1% QoQ and up 3.8% YoY in the second quarter of the year. The RBA Trimmed Mean CPI, the central bank’s preferred gauge, rose by 3.9% YoY in Q2, against the expected and previous reading of 4.0%.
Technical Analysis: Australian Dollar holds position around 0.6500
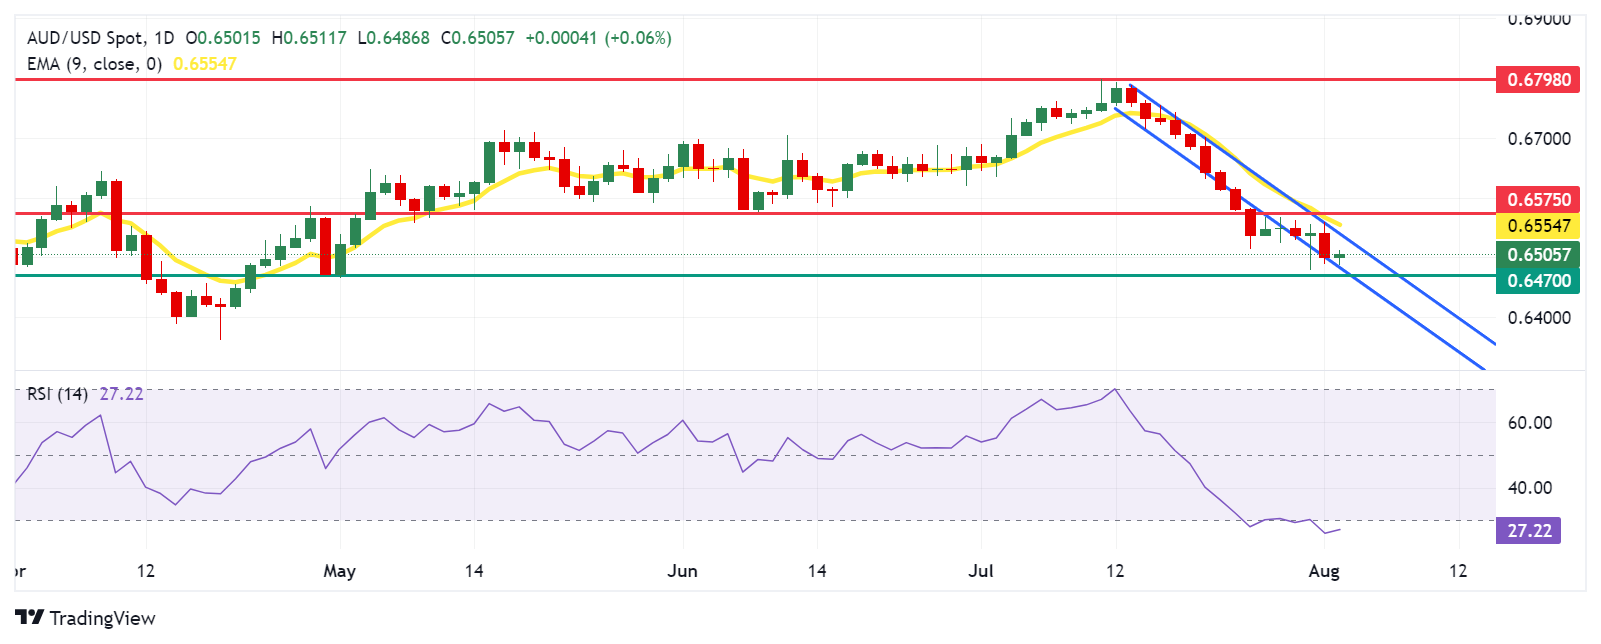
The Australian Dollar trades around 0.6510 on Friday. The daily chart analysis shows that the AUD/USD pair consolidates within a descending channel, indicating a bearish bias. The 14-day Relative Strength Index (RSI) is near the oversold 30 level, suggesting a potential upward correction might be imminent.
Immediate support for the AUD/USD pair is around the lower boundary of the descending channel at 0.6470, followed by the throwback support at approximately 0.6470.
On the upside, the upper boundary of the descending channel at 0.6530 serves as the immediate resistance, followed by the nine-day Exponential Moving Average (EMA) at 0.6555. The next barrier for the AUD/USD pair appears at the “throwback support turned resistance” at 0.6575. A break above this resistance could drive the AUD/USD pair toward a six-month high of 0.6798.
AUD/USD: Daily Chart
Australian Dollar PRICE Today
The table below shows the percentage change of Australian Dollar (AUD) against listed major currencies today. Australian Dollar was the strongest against the British Pound.
| USD | EUR | GBP | JPY | CAD | AUD | NZD | CHF | |
|---|---|---|---|---|---|---|---|---|
| USD | -0.08% | 0.08% | -0.21% | -0.10% | -0.20% | -0.04% | -0.22% | |
| EUR | 0.08% | 0.14% | -0.11% | -0.04% | -0.12% | 0.02% | -0.14% | |
| GBP | -0.08% | -0.14% | -0.28% | -0.17% | -0.29% | -0.12% | -0.27% | |
| JPY | 0.21% | 0.11% | 0.28% | 0.11% | 0.00% | 0.15% | -0.00% | |
| CAD | 0.10% | 0.04% | 0.17% | -0.11% | -0.10% | 0.07% | -0.09% | |
| AUD | 0.20% | 0.12% | 0.29% | -0.01% | 0.10% | 0.16% | 0.00% | |
| NZD | 0.04% | -0.02% | 0.12% | -0.15% | -0.07% | -0.16% | -0.14% | |
| CHF | 0.22% | 0.14% | 0.27% | 0.00% | 0.09% | 0.00% | 0.14% |
The heat map shows percentage changes of major currencies against each other. The base currency is picked from the left column, while the quote currency is picked from the top row. For example, if you pick the Australian Dollar from the left column and move along the horizontal line to the US Dollar, the percentage change displayed in the box will represent AUD (base)/USD (quote).
Inflation FAQs
Inflation measures the rise in the price of a representative basket of goods and services. Headline inflation is usually expressed as a percentage change on a month-on-month (MoM) and year-on-year (YoY) basis. Core inflation excludes more volatile elements such as food and fuel which can fluctuate because of geopolitical and seasonal factors. Core inflation is the figure economists focus on and is the level targeted by central banks, which are mandated to keep inflation at a manageable level, usually around 2%.
The Consumer Price Index (CPI) measures the change in prices of a basket of goods and services over a period of time. It is usually expressed as a percentage change on a month-on-month (MoM) and year-on-year (YoY) basis. Core CPI is the figure targeted by central banks as it excludes volatile food and fuel inputs. When Core CPI rises above 2% it usually results in higher interest rates and vice versa when it falls below 2%. Since higher interest rates are positive for a currency, higher inflation usually results in a stronger currency. The opposite is true when inflation falls.
Although it may seem counter-intuitive, high inflation in a country pushes up the value of its currency and vice versa for lower inflation. This is because the central bank will normally raise interest rates to combat the higher inflation, which attract more global capital inflows from investors looking for a lucrative place to park their money.
Formerly, Gold was the asset investors turned to in times of high inflation because it preserved its value, and whilst investors will often still buy Gold for its safe-haven properties in times of extreme market turmoil, this is not the case most of the time. This is because when inflation is high, central banks will put up interest rates to combat it. Higher interest rates are negative for Gold because they increase the opportunity-cost of holding Gold vis-a-vis an interest-bearing asset or placing the money in a cash deposit account. On the flipside, lower inflation tends to be positive for Gold as it brings interest rates down, making the bright metal a more viable investment alternative.
Author

Akhtar Faruqui
FXStreet
Akhtar Faruqui is a Forex Analyst based in New Delhi, India. With a keen eye for market trends and a passion for dissecting complex financial dynamics, he is dedicated to delivering accurate and insightful Forex news and analysis.


