Australian Dollar rises as US Dollar trims gains on Fed rate cut likelihood
- Australian Dollar steadies as last week’s robust July Trade Surplus and stronger Q2 GDP data reduce RBA rate cut bets.
- China’s Trade Balance climbed to CNY 732.7 billion in August, from CNY 705.18 billion previously.
- The US Dollar softened after downbeat August jobs data strengthened expectations of Fed rate cuts.

The Australian Dollar (AUD) extends its gains against the US Dollar (USD) on Monday, following gains of more than 0.5% in the previous session. The AUD/USD pair gained ground as the US Dollar weakened after weaker-than-expected August jobs data heightened concerns over a slowing economy and reinforced expectations of United States (US) Federal Reserve (Fed) rate cuts.
China’s Trade Balance rose to CNY 732.7 billion in August, up from CNY 705.18 billion previously. Exports rose 4.8% YoY in August vs. 8% in July. The country’s imports advanced 1.7% YoY in the same period vs. 4.8% recorded previously.
The AUD also draws support as last week’s solid July Trade Surplus and Q2 GDP figures eased expectations of additional Reserve Bank of Australia (RBA) rate cuts. Swaps are now assigning nearly a 90% probability that the RBA will keep policy unchanged in September, while the likelihood of a 25-basis-point rate cut in November has eased to 80% from 100%.
Australia’s Trade Balance increased to 7,310 million month-over-month in July, from 5,366 million the prior month. The trade surplus widened against the expected decline to 4,920 million. Gross Domestic Product (GDP) rose by 0.6% quarter-over-quarter in Q2, following the 0.3% growth in Q1 and surpassing the expectations of 0.5% expansion. Meanwhile, the annual Q2 GDP grew by 1.8%, compared with the 1.4% growth in Q1, and was above the consensus of a 1.6% increase.
Australian Dollar rises amid rising Fed rate cut bets
- The US Dollar Index (DXY), which measures the value of the US Dollar against six major currencies, is edging higher and trading around 97.90 at the time of writing. The CME FedWatch tool indicates a pricing in 92% of a 25-basis-point (bps) rate cut by the Fed at the September policy meeting, up from 86% a week ago, with bets rising on a potential 50 bps reduction this month.
- Federal Reserve (Fed) Bank of Chicago President Austan Goolsbee said in an interview on Bloomberg TV on Friday that he is still unsure whether September is the right time for an interest rate cut, following weaker jobs data. He added that high inflation data is still cause for concern, and key Fed officials may not be fully sold on a September rate cut.
- The US Bureau of Labor Statistics (BLS) reported on Friday that the US Nonfarm Payrolls (NFP) rose by 22,000 in August, falling short of the market expectations of 75,000. This figure followed the 79,000 increase (revised from 73,000) recorded in July. Meanwhile, the Unemployment Rate increased to 4.3% in August, as expected, against the 4.2% prior. Average Hourly Earnings increased 0.3% MoM in August, in line with expectations.
- Reuters reported late Thursday that US President Donald Trump said that his administration would impose tariffs on semiconductor imports from firms not moving production to the United States. Moreover, the Trump administration is set to begin renegotiating the US-Mexico-Canada free trade deal, according to The Wall Street Journal.
- The US Initial Jobless Claims rose to 237K for the week ending August 30, against the previous reading of 229K. This figure came in above the market consensus of 230K. Meanwhile, ADP Employment Change showed that employment rose by 54,000 in August, which came in below the expectation of 65K. This reading followed a 106K (revised from 104K) increase recorded in July.
- China’s Caixin Services Purchasing Managers' Index (PMI) unexpectedly rose to 53.0 in August from 52.6 in July. The data came in above the market forecast of 52.5 in the reported period. Caixin Manufacturing PMI jumped to 50.5 in August from 49.5 in July. It is worth noting that any change in the Chinese economy could influence AUD as China and Australia are close trading partners.
- Australia’s Monthly Consumer Price Index rose 2.8% year-over-year in July, beating both the previous 1.9% increase and the 2.3% forecast. The hotter inflation in July dampened the likelihood of a Reserve Bank of Australia (RBA) rate cut anytime soon, continuing to provide support for the Australian Dollar.
Australian Dollar rises above 0.6550 toward seven-week highs
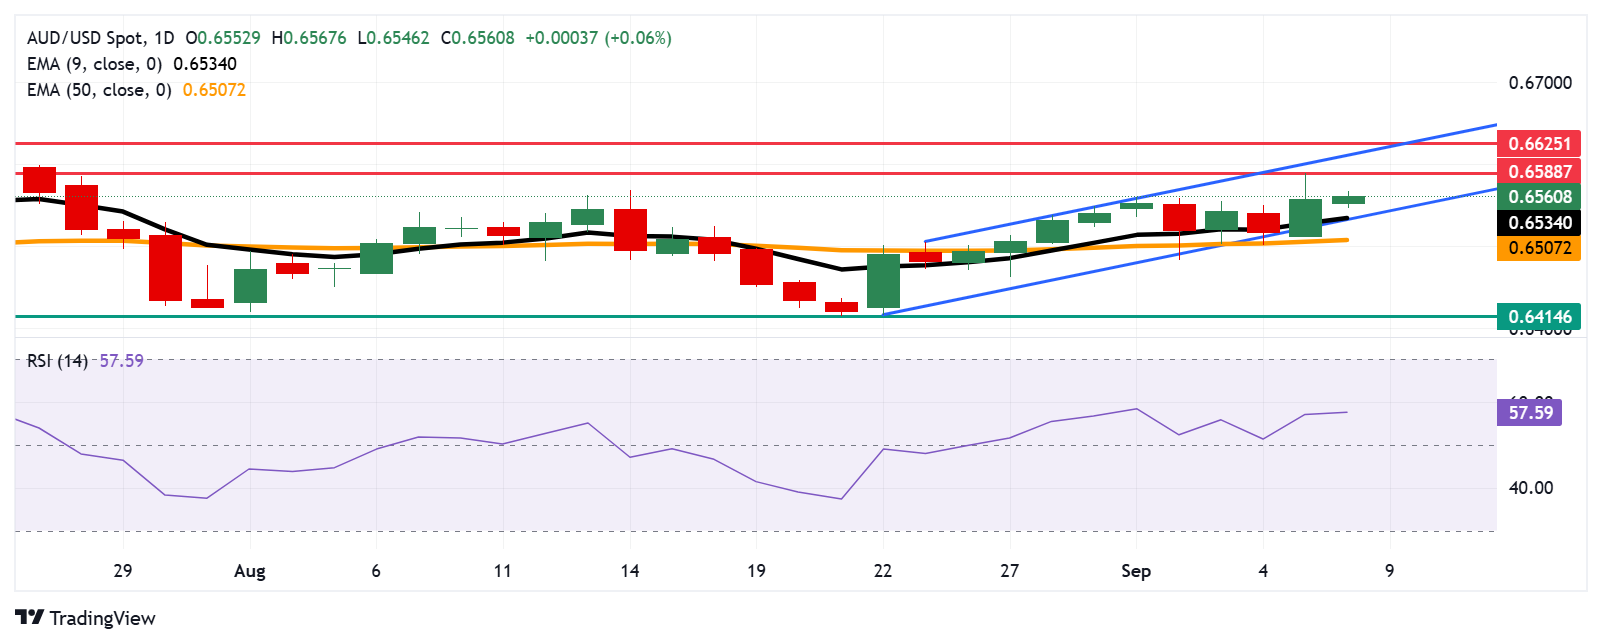
AUD/USD is trading around 0.6560 on Monday. The technical analysis of the daily chart shows the pair remains within the ascending channel pattern, indicating the market sentiment is bullish. Additionally, the pair is positioned above the nine-day Exponential Moving Average (EMA), indicating short-term price momentum is strengthening.
On the upside, the AUD/USD pair may target the seven-week high of 0.6588, reached on September 5, followed by the upper boundary of the ascending channel at around 0.6610. A break above the channel would strengthen the bullish bias and support the pair to test the 10-month high of 0.6625, which was recorded on July 24.
The immediate support appears at the nine-day EMA of 0.6534, aligned with the ascending channel’s lower boundary. A break below this crucial support zone would weaken the bullish bias and prompt the AUD/USD pair to test the 50-day EMA at 0.6507. Further declines would dampen the medium-term price momentum and open the doors for the pair to navigate the region around the three-month low of 0.6414, recorded on August 21.
AUD/USD: Daily Chart
Australian Dollar Price Today
The table below shows the percentage change of Australian Dollar (AUD) against listed major currencies today. Australian Dollar was the strongest against the US Dollar.
| USD | EUR | GBP | JPY | CAD | AUD | NZD | CHF | |
|---|---|---|---|---|---|---|---|---|
| USD | -0.04% | -0.01% | -0.18% | -0.02% | -0.28% | -0.26% | -0.21% | |
| EUR | 0.04% | 0.02% | -0.05% | 0.01% | -0.24% | -0.18% | -0.17% | |
| GBP | 0.01% | -0.02% | -0.16% | -0.01% | -0.25% | -0.20% | -0.19% | |
| JPY | 0.18% | 0.05% | 0.16% | 0.09% | -0.13% | -0.24% | -0.01% | |
| CAD | 0.02% | -0.01% | 0.00% | -0.09% | -0.17% | -0.19% | -0.19% | |
| AUD | 0.28% | 0.24% | 0.25% | 0.13% | 0.17% | 0.05% | 0.07% | |
| NZD | 0.26% | 0.18% | 0.20% | 0.24% | 0.19% | -0.05% | 0.01% | |
| CHF | 0.21% | 0.17% | 0.19% | 0.00% | 0.19% | -0.07% | -0.01% |
The heat map shows percentage changes of major currencies against each other. The base currency is picked from the left column, while the quote currency is picked from the top row. For example, if you pick the Australian Dollar from the left column and move along the horizontal line to the US Dollar, the percentage change displayed in the box will represent AUD (base)/USD (quote).
Australian Dollar FAQs
One of the most significant factors for the Australian Dollar (AUD) is the level of interest rates set by the Reserve Bank of Australia (RBA). Because Australia is a resource-rich country another key driver is the price of its biggest export, Iron Ore. The health of the Chinese economy, its largest trading partner, is a factor, as well as inflation in Australia, its growth rate and Trade Balance. Market sentiment – whether investors are taking on more risky assets (risk-on) or seeking safe-havens (risk-off) – is also a factor, with risk-on positive for AUD.
The Reserve Bank of Australia (RBA) influences the Australian Dollar (AUD) by setting the level of interest rates that Australian banks can lend to each other. This influences the level of interest rates in the economy as a whole. The main goal of the RBA is to maintain a stable inflation rate of 2-3% by adjusting interest rates up or down. Relatively high interest rates compared to other major central banks support the AUD, and the opposite for relatively low. The RBA can also use quantitative easing and tightening to influence credit conditions, with the former AUD-negative and the latter AUD-positive.
China is Australia’s largest trading partner so the health of the Chinese economy is a major influence on the value of the Australian Dollar (AUD). When the Chinese economy is doing well it purchases more raw materials, goods and services from Australia, lifting demand for the AUD, and pushing up its value. The opposite is the case when the Chinese economy is not growing as fast as expected. Positive or negative surprises in Chinese growth data, therefore, often have a direct impact on the Australian Dollar and its pairs.
Iron Ore is Australia’s largest export, accounting for $118 billion a year according to data from 2021, with China as its primary destination. The price of Iron Ore, therefore, can be a driver of the Australian Dollar. Generally, if the price of Iron Ore rises, AUD also goes up, as aggregate demand for the currency increases. The opposite is the case if the price of Iron Ore falls. Higher Iron Ore prices also tend to result in a greater likelihood of a positive Trade Balance for Australia, which is also positive of the AUD.
The Trade Balance, which is the difference between what a country earns from its exports versus what it pays for its imports, is another factor that can influence the value of the Australian Dollar. If Australia produces highly sought after exports, then its currency will gain in value purely from the surplus demand created from foreign buyers seeking to purchase its exports versus what it spends to purchase imports. Therefore, a positive net Trade Balance strengthens the AUD, with the opposite effect if the Trade Balance is negative.
Author

Akhtar Faruqui
FXStreet
Akhtar Faruqui is a Forex Analyst based in New Delhi, India. With a keen eye for market trends and a passion for dissecting complex financial dynamics, he is dedicated to delivering accurate and insightful Forex news and analysis.


