Australian Dollar depreciates following mixed inflation data, Fed decision eyed
- The Australian Dollar declines after the release of CPI data.
- Australia's Monthly CPI rose by 3.8% YoY, easing from the 4.0% posted in May.
- The US Dollar extends losses ahead of the Fed interest rate decision scheduled for Wednesday.

The Australian Dollar (AUD) falls against the US Dollar (USD) after the release of mixed Consumer Price Index (CPI) data released on Wednesday, offering potential insights into the future direction of the Reserve Bank of Australia’s (RBA) monetary policy.
This inflation report has raised expectations that the Reserve Bank of Australia (RBA) may choose to keep interest rates unchanged at its policy meeting next week. However, economists have cautioned that further interest rate hikes could jeopardize Australia’s economic recovery.
Additionally, China's NBS Manufacturing PMI posted a reading of 49.4 for July, slightly above the expected 49.3 but below the prior 49.5. Meanwhile, the Non-Manufacturing PMI came in at 50.2 as expected. Since changes in the Chinese economy can significantly impact the Australian market, these PMI readings are particularly relevant.
The downside of the AUD/USD pair might be limited as the US Dollar (USD) faces challenges ahead of the Federal Reserve’s (Fed) upcoming interest rate decision scheduled for Wednesday.
The Federal Reserve is expected to keep rates unchanged in July, but there is growing anticipation of a rate cut in September. This speculation is putting pressure on the USD. Additionally, signs of cooling inflation and easing labor market conditions in the United States are further fueling expectations of multiple rate cuts by the Fed this year, potentially totaling three cuts.
Daily Digest Market Movers: Australian Dollar declines due to risk aversion
- The Australian Bureau of Statistics (ABS) reported that the Monthly CPI rose by 3.8% in the year to June, easing from the 4% posted in May. The quarterly CPI rose 1% QoQ and up 3.8% YoY in the second quarter of the year. The RBA Trimmed Mean CPI, the central bank’s preferred gauge, rose by 3.9% YoY in Q2, against the expected and previous reading of 4.0%.
- Australia's Building Permits (MoM) fell by 6.5% in June, exceeding market expectations of a 3.0% decline. This follows a 5.7% increase in May. On a year-over-year basis, Building Permits declined by 3.7%, compared to the previous year's decline of 8.5%.
- National Australia Bank (NAB) anticipates that the Reserve Bank of Australia's (RBA) cash rate will remain stable at 4.35% until May 2025, according to a recent NAB Economics outlook. Looking ahead, the NAB Economics team predicts a decline to 3.6% by December 2025, with further decreases expected in 2026.
- In a media release on Monday, the Australian Prudential Regulation Authority (APRA) warned that arrears rates are increasing slowly. Following their latest quarterly assessment of domestic and international economic conditions, APRA announced that they will keep macroprudential policy settings on hold. These comments reflect their ongoing evaluation of both domestic and global economic environments.
- Bank of America suggests that robust economic growth in the United States enables the Federal Open Market Committee (FOMC) to "afford to wait" before implementing any adjustments. The BofA notes that the economy "remains strong" and expects the Fed to begin rate cuts in December.
Technical Analysis: Australian Dollar falls to near 0.6500
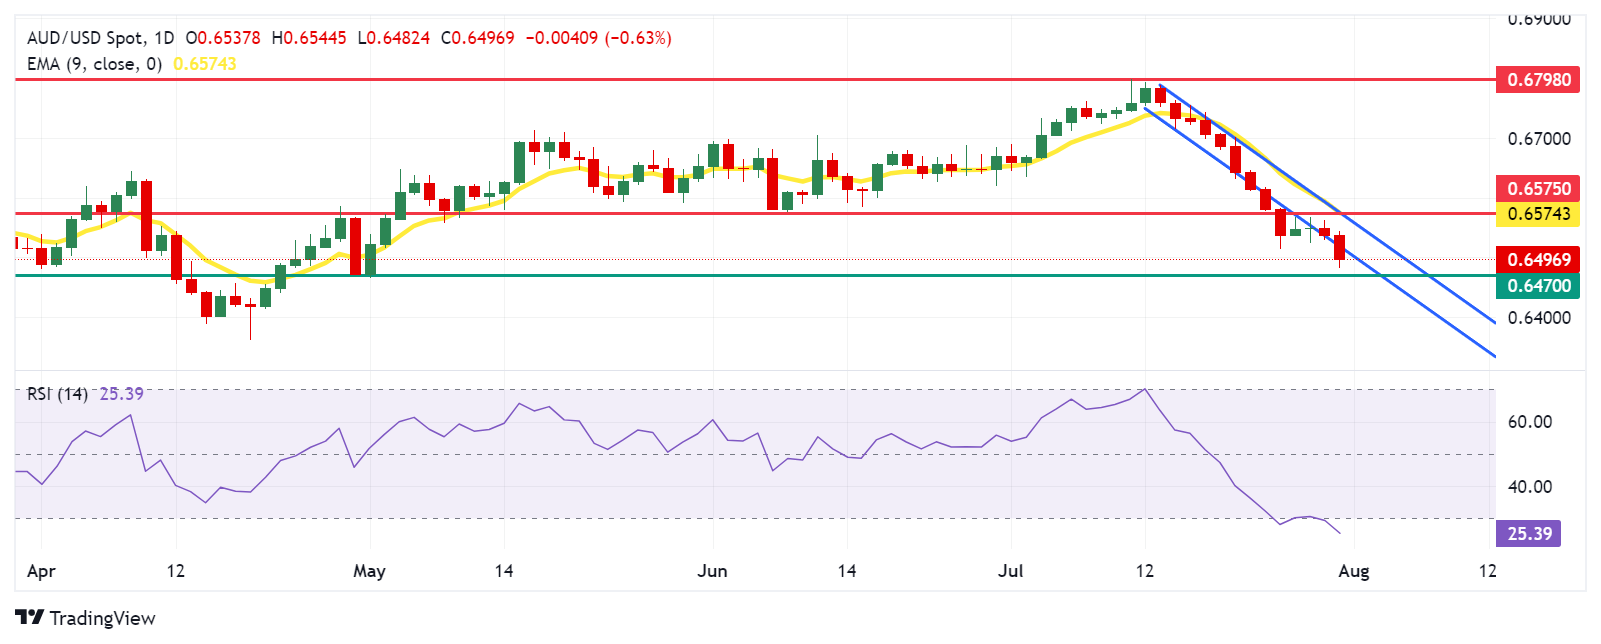
The Australian Dollar trades around 0.6500 on Wednesday. The daily chart analysis shows that the AUD/USD pair has broken below a descending channel. The 14-day Relative Strength Index (RSI) is hovering near the oversold 30 level, indicating a potential upward correction soon.
Immediate support for the AUD/USD pair is around the throwback support around the 0.6470 level.
On the upside, key resistance is around the “throwback support turned resistance” at 0.6575, aligned with the nine-day Exponential Moving Average (EMA) at 0.6581. A break above this level could lead the AUD/USD pair to test the psychological level of 0.6600, with a potential aim for a six-month high of 0.6798.
AUD/USD: Daily Chart
Australian Dollar PRICE Today
The table below shows the percentage change of Australian Dollar (AUD) against listed major currencies today. Australian Dollar was the weakest against the New Zealand Dollar.
| USD | EUR | GBP | JPY | CAD | AUD | NZD | CHF | |
|---|---|---|---|---|---|---|---|---|
| USD | -0.05% | -0.05% | 0.09% | -0.05% | 0.74% | -0.07% | -0.05% | |
| EUR | 0.05% | 0.02% | 0.15% | -0.01% | 0.78% | -0.00% | 0.00% | |
| GBP | 0.05% | -0.02% | 0.12% | -0.03% | 0.75% | -0.02% | -0.01% | |
| JPY | -0.09% | -0.15% | -0.12% | -0.11% | 0.62% | -0.17% | -0.12% | |
| CAD | 0.05% | 0.01% | 0.03% | 0.11% | 0.77% | -0.01% | -0.02% | |
| AUD | -0.74% | -0.78% | -0.75% | -0.62% | -0.77% | -0.78% | -0.78% | |
| NZD | 0.07% | 0.00% | 0.02% | 0.17% | 0.01% | 0.78% | 0.00% | |
| CHF | 0.05% | -0.01% | 0.01% | 0.12% | 0.02% | 0.78% | -0.01% |
The heat map shows percentage changes of major currencies against each other. The base currency is picked from the left column, while the quote currency is picked from the top row. For example, if you pick the Australian Dollar from the left column and move along the horizontal line to the US Dollar, the percentage change displayed in the box will represent AUD (base)/USD (quote).
Economic Indicator
Fed Interest Rate Decision
The Federal Reserve (Fed) deliberates on monetary policy and makes a decision on interest rates at eight pre-scheduled meetings per year. It has two mandates: to keep inflation at 2%, and to maintain full employment. Its main tool for achieving this is by setting interest rates – both at which it lends to banks and banks lend to each other. If it decides to hike rates, the US Dollar (USD) tends to strengthen as it attracts more foreign capital inflows. If it cuts rates, it tends to weaken the USD as capital drains out to countries offering higher returns. If rates are left unchanged, attention turns to the tone of the Federal Open Market Committee (FOMC) statement, and whether it is hawkish (expectant of higher future interest rates), or dovish (expectant of lower future rates).
Read more.Next release: Wed Jul 31, 2024 18:00
Frequency: Irregular
Consensus: 5.5%
Previous: 5.5%
Source: Federal Reserve
Author

Akhtar Faruqui
FXStreet
Akhtar Faruqui is a Forex Analyst based in New Delhi, India. With a keen eye for market trends and a passion for dissecting complex financial dynamics, he is dedicated to delivering accurate and insightful Forex news and analysis.

















