- AUDUSD bears are still in play on the hourly chart while below the 50% mean reversion level with 0.6400 the figure eyed.
- Bulls are in the backside of the daily trendline which poses risks to the upside.
AUDUSD is trading at 0.6430, flat on the day and within a range of 0.6422 and 0.6436 following a volatile day on Wednesday. It is suffering a blow on the back of a strong US Dollar and yields that rallied due to a soft US Treasury auction. This comes ahead of the US inflation data that will be out today in the US session. Meanwhile, the price is technically meeting a key resistance following a retracement into the 0.6430s, rising from the overnight lows and a slide some 100 pips higher.
AUDUSD daily chart
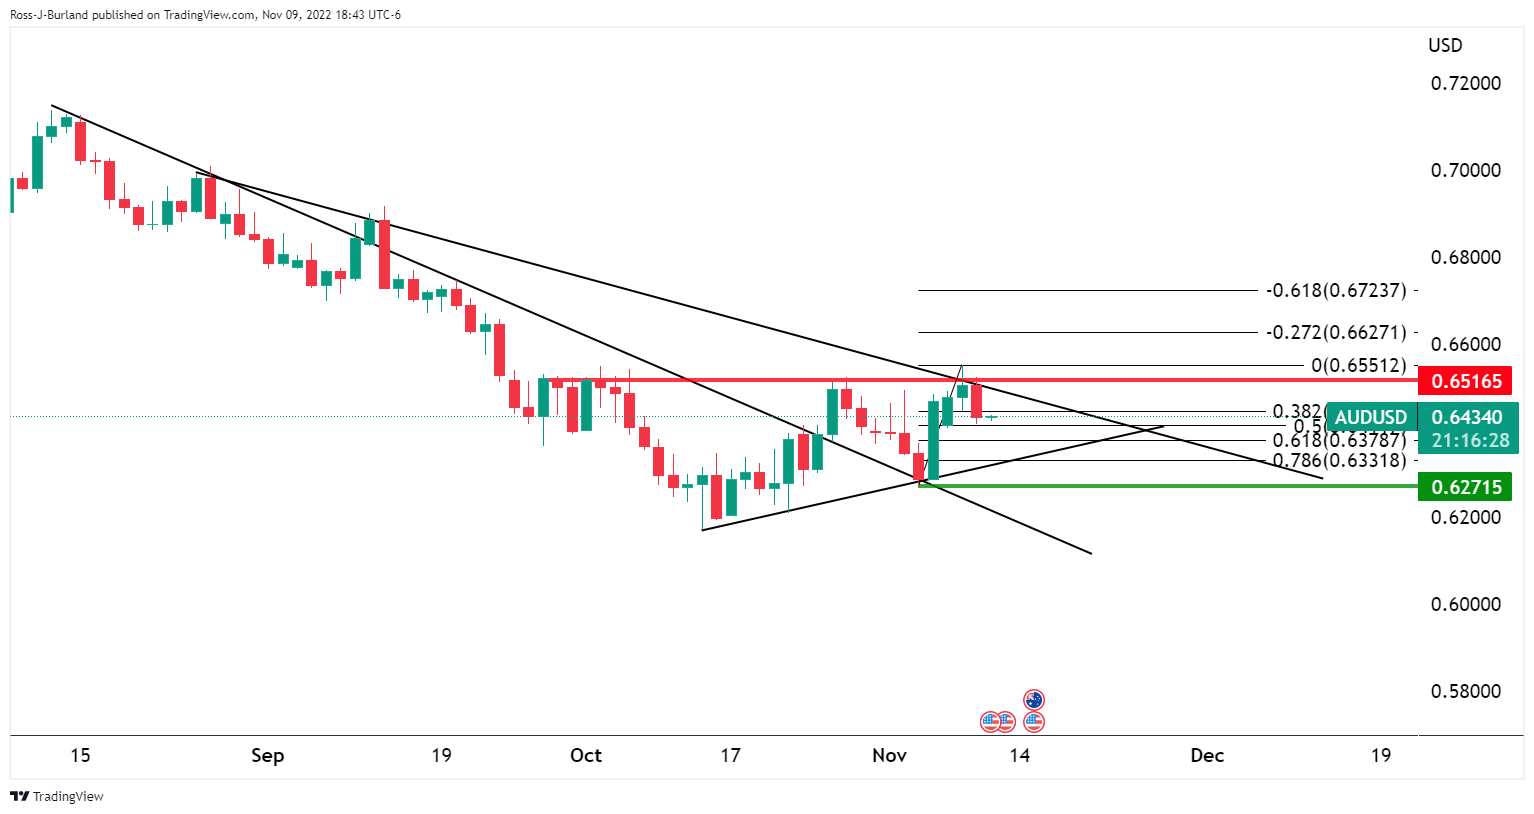
From a daily perspective, however, the price has been building a bullish outlook on the backside of the trendline, albeit now rubbing up against a new trendline resistance as illustrated above. However, the bearish engulfment could be problematic for the bulls while below 0.6500/16.
AUDUSD H1 chart
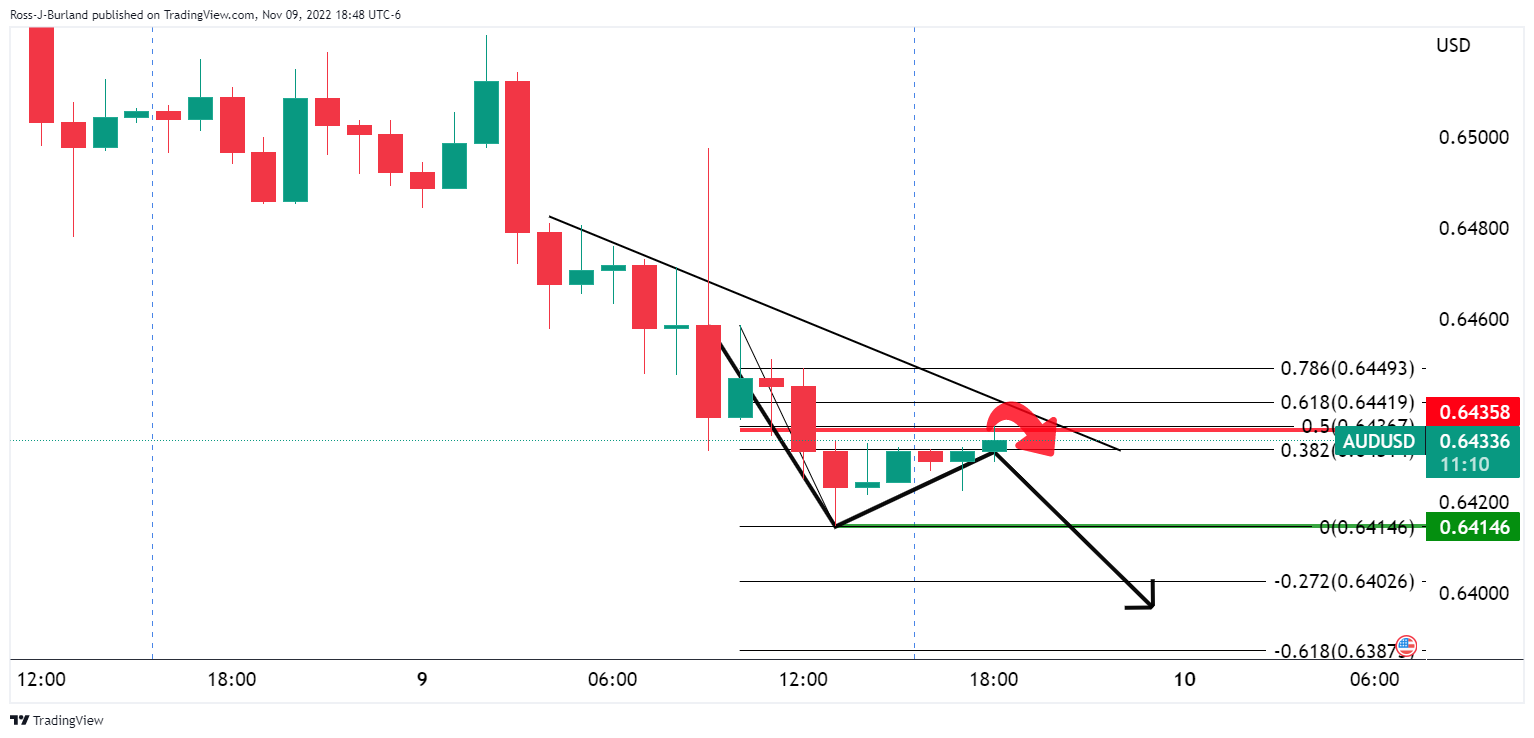
Meanwhile, the bears are still in play on the hourly chart while below the 50% mean reversion level and there are prospects of a downside extension to test 0.6400 the figure.
Information on these pages contains forward-looking statements that involve risks and uncertainties. Markets and instruments profiled on this page are for informational purposes only and should not in any way come across as a recommendation to buy or sell in these assets. You should do your own thorough research before making any investment decisions. FXStreet does not in any way guarantee that this information is free from mistakes, errors, or material misstatements. It also does not guarantee that this information is of a timely nature. Investing in Open Markets involves a great deal of risk, including the loss of all or a portion of your investment, as well as emotional distress. All risks, losses and costs associated with investing, including total loss of principal, are your responsibility. The views and opinions expressed in this article are those of the authors and do not necessarily reflect the official policy or position of FXStreet nor its advertisers. The author will not be held responsible for information that is found at the end of links posted on this page.
If not otherwise explicitly mentioned in the body of the article, at the time of writing, the author has no position in any stock mentioned in this article and no business relationship with any company mentioned. The author has not received compensation for writing this article, other than from FXStreet.
FXStreet and the author do not provide personalized recommendations. The author makes no representations as to the accuracy, completeness, or suitability of this information. FXStreet and the author will not be liable for any errors, omissions or any losses, injuries or damages arising from this information and its display or use. Errors and omissions excepted.
The author and FXStreet are not registered investment advisors and nothing in this article is intended to be investment advice.
Recommended content
Editors’ Picks
![EUR/USD eases to daily lows near 1.0260](https://editorial.fxsstatic.com/images/i/EURUSD-bearish-line_Medium.png)
EUR/USD eases to daily lows near 1.0260
Better-than-expected results from the US docket on Friday lend wings to the US Dollar and spark a corrective decline in EUR/USD to the area of daily lows near 1.0260.
![GBP/USD remains under pressure on strong Dollar, data](https://editorial.fxsstatic.com/images/i/GBPUSD-bearish-object_Medium.png)
GBP/USD remains under pressure on strong Dollar, data
GBP/USD remains on track to close another week of losses on Friday, hovering around the 1.2190 zone against the backdrop of the bullish bias in the Greenback and poor results from the UK calendar.
![Gold recedes from tops, retests $2,700](https://editorial.fxsstatic.com/images/i/Commodities_Gold-1_Medium.jpg)
Gold recedes from tops, retests $2,700
The daily improvement in the Greenback motivates Gold prices to give away part of the weekly strong advance and slip back to the vicinity of the $2,700 region per troy ounce at the end of the week.
![Five keys to trading Trump 2.0 with Gold, Stocks and the US Dollar](https://editorial.fxsstatic.com/images/i/Public-Figures_Donald-Trump_1_Medium.jpg)
Five keys to trading Trump 2.0 with Gold, Stocks and the US Dollar Premium
Donald Trump returns to the White House, which impacts the trading environment. An immediate impact on market reaction functions, tariff talk and regulation will be seen. Tax cuts and the fate of the Federal Reserve will be in the background.
![Hedara bulls aim for all-time highs](https://editorial.fxsstatic.com/images/i/cryptos-coins_Medium.png)
Hedara bulls aim for all-time highs
Hedara’s price extends its gains, trading at $0.384 on Friday after rallying more than 38% this week. Hedara announces partnership with Vaultik and World Gemological Institute to tokenize $3 billion in diamonds and gemstones
![Trusted Broker Reviews for Smarter Trading](https://editorial.fxsstatic.com/images/IT/BrokerReview2025_Medium.png)
Trusted Broker Reviews for Smarter Trading
VERIFIED Discover in-depth reviews of reliable brokers. Compare features like spreads, leverage, and platforms. Find the perfect fit for your trading style, from CFDs to Forex pairs like EUR/USD and Gold.