|
AUD/USD technical analysis: Sharp turnaround after hitting new October highs above 0.6900 handle
- The Aussie is trading near daily lows after reaching new monthly highs.
- The level to beat for bears is the 0.6870 support level.

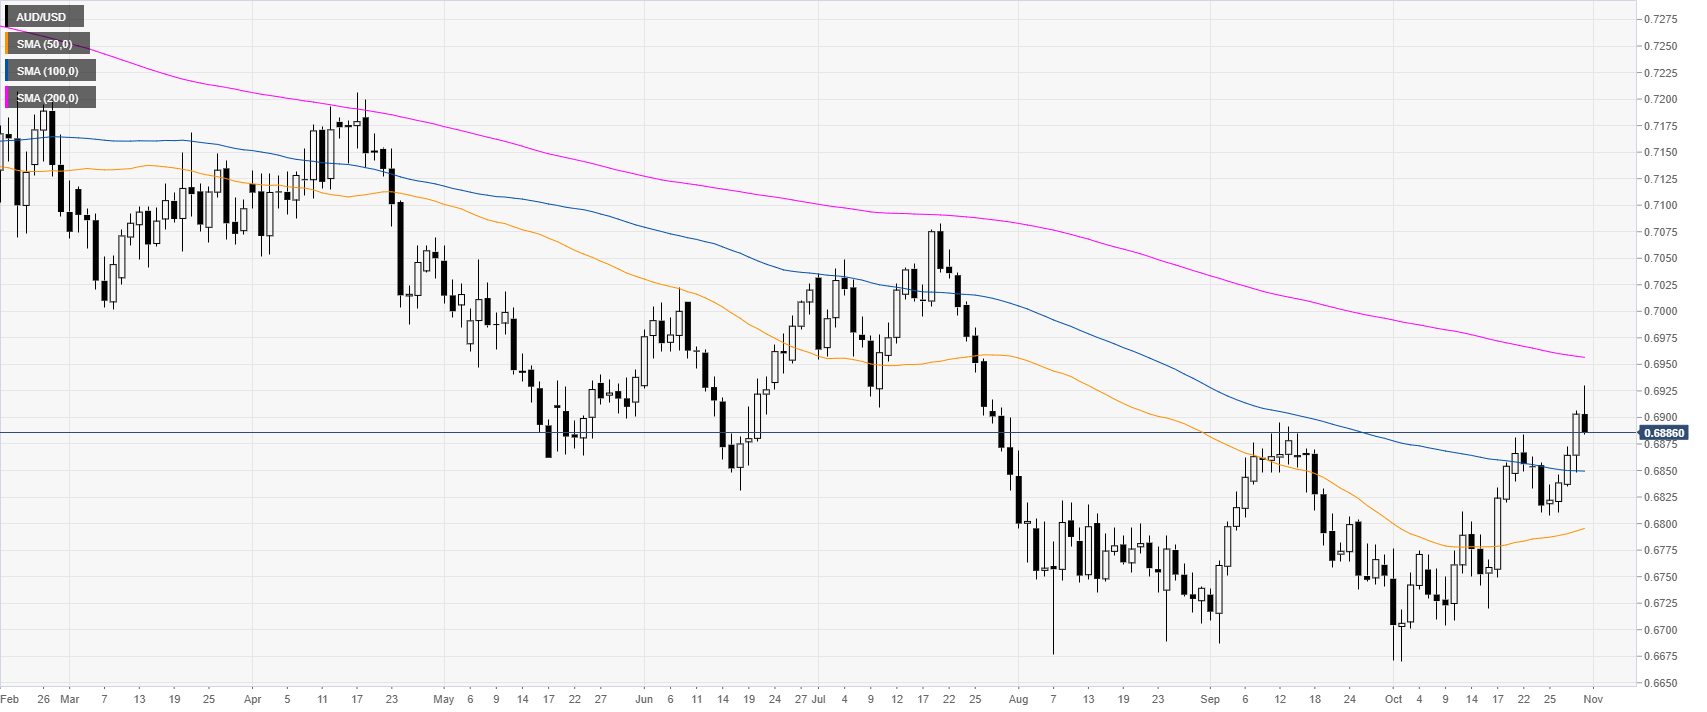
AUD/USD daily chart
The Aussie is trading in a bear trend below the 200-day simple moving average (DMA) on the daily chart. This Thursday the Aussie reached a new October high shooting above the 0.6900 handle. However, the spot is retreating and is at press time trading near daily lows.
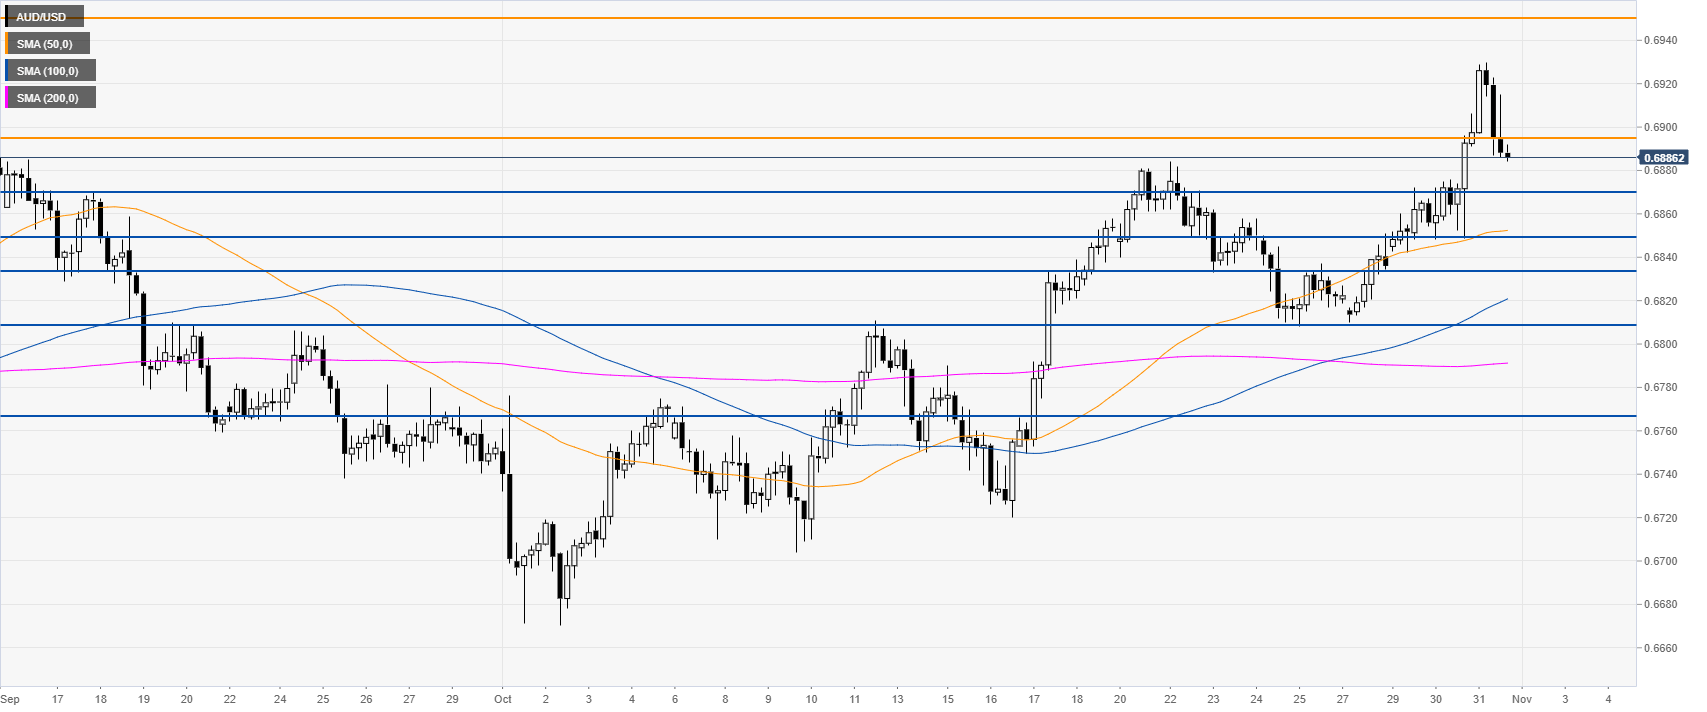
AUD/USD 4-hour chart
The spot is trading above its main SMAs, suggesting a bullish bias in the medium term. However, the spot is having a sharp turnaround now trading back below the 0.6895 resistance. If bulls can reclaim this level, they might try to regain the recent high at 0.6930. Otherwise, the market may continue to drift down towards 0.6870 and 0.6849 support level, according to the Technical Confluences Indicator.
Additional key levels
Author

Flavio Tosti
Independent Analyst
More from Flavio Tosti


