|
AUD/USD Technical Analysis: Bullish RSI divergence is seen on hourly chart
- The bullish price-relative strength index (RSI) divergence seen in the hourly chart indicates scope for a minor corrective rally to falling (bearish) 10-day moving average (MA) hurdle, currently located at 0.7392.
- Also, the hourly RSI has diverged in favor of the bulls at a time when the spot is trading at the key support of 0.7327 - 61.8 percent Fibonacci retracement of Jan 2016 low - Jan 2018 high.
- The primary trend remains bearish as indicated by the downward sloping 5-week and 10-week MA.

Hourly chart
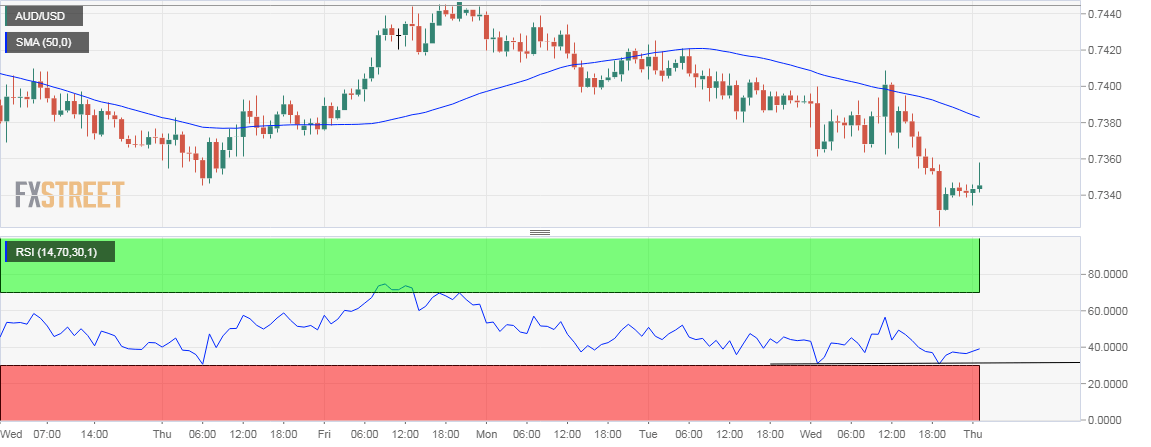
Spot Rate: 0.7350
Daily High: 0.7356
Daily Low: .7334
Trend: Corrective rally on cards
R1: 0.7361 (resistance on hourly chart)
R2: 0.7383 (falling 50-hour MA)
R3: 0.7392 (falling 10-day MA)
Support
S1: 0.7327 (61.8% Fib R of Jan 2016 low - Jan 2018 high)
S2: 0.7234 (July 2015 low)
S3: 0.7160 (December 2016 low)
Author

Omkar Godbole
FXStreet Contributor
Omkar Godbole, editor and analyst, joined FXStreet after four years as a research analyst at several Indian brokerage companies.
More from Omkar Godbole


