AUD/USD Technical Analysis: Aussie trading below 0.7130 ahead of RBA

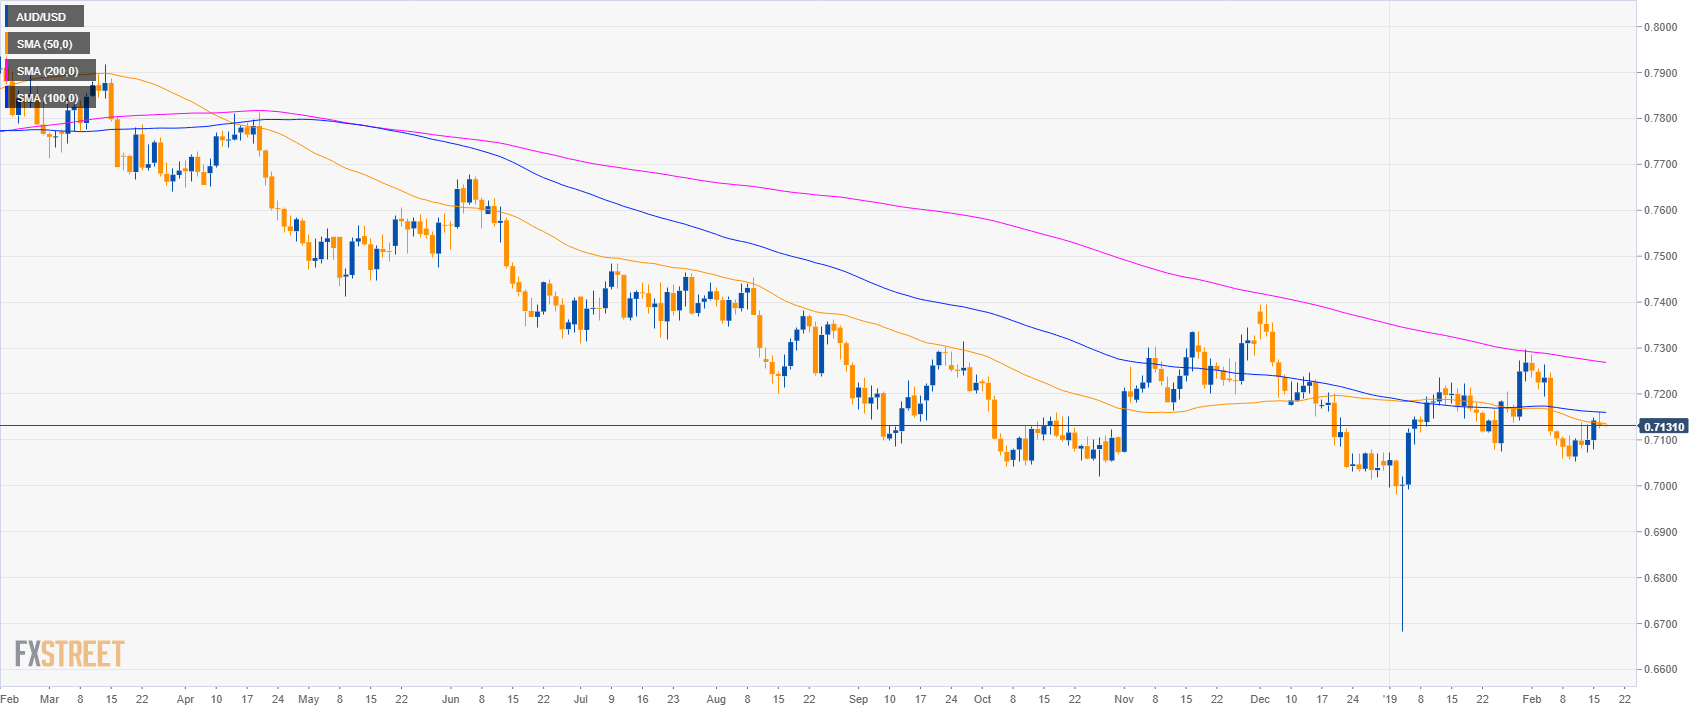
AUD/USD daily chart
- AUD/USD is trading in a bear trend below the 200-day simple moving average (SMA).
- The Reserve Bank of Australia Meeting's Minutes at 00:30 GMT can potentially provide great volatility in AUD-related pair.
AUD/USD 4-hour chart
- AUD/USD is trading between the 50 and 200 SMA suggesting a sideways market in the medium-term.
- The 0.7240 bullish target remains in place as long as AUD/USD trades above the 0.7000 figure.

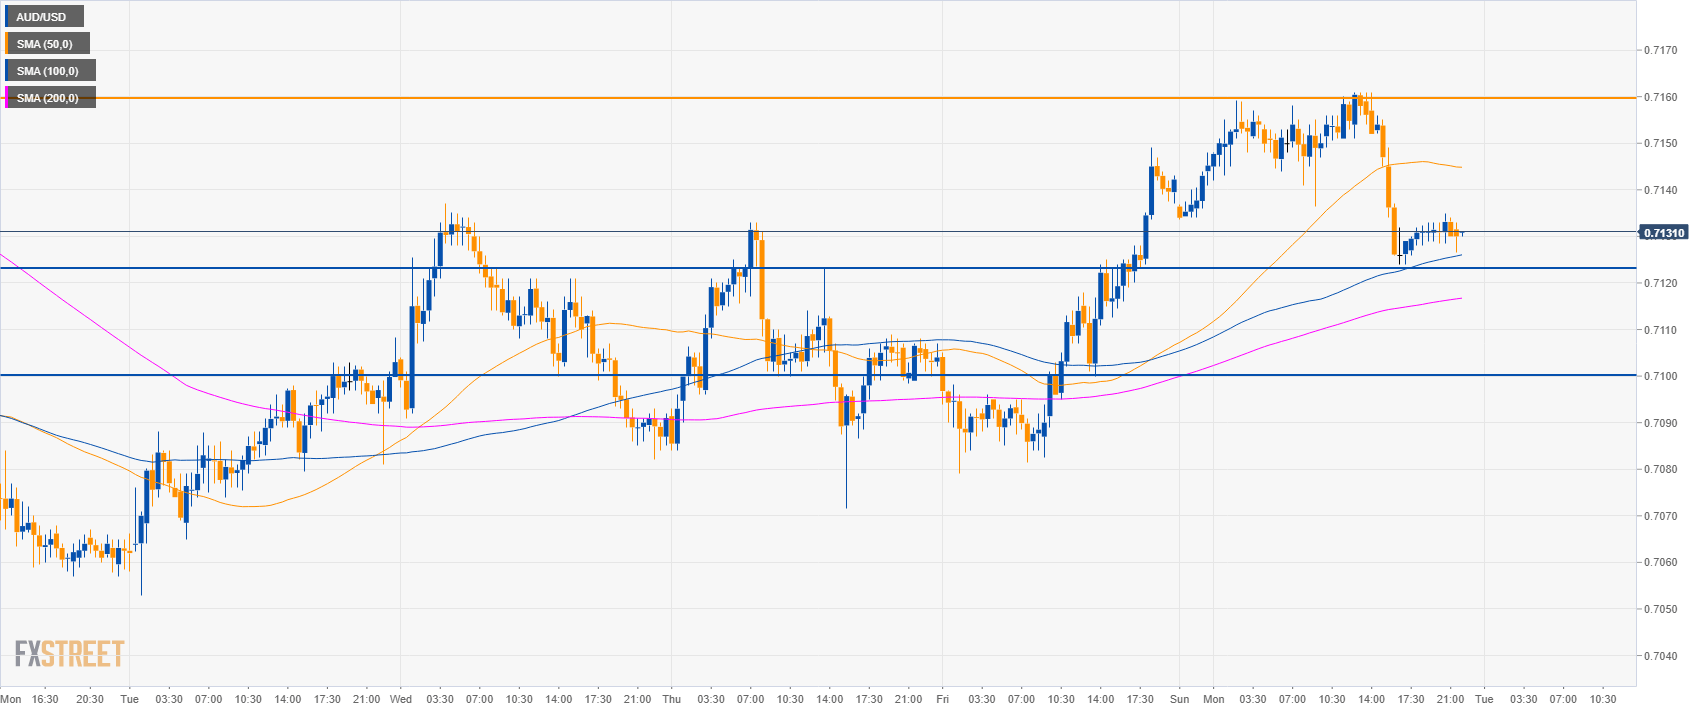
AUD/USD 30-minute chart
- In the short-term AUD/USD is most likely to decline to 0.7100 figure.
- Resistance is seen at 0.7160 level.
Additional key levels
AUD/USD
Overview:
Today Last Price: 0.713
Today Daily change: -12 pips
Today Daily change %: -0.17%
Today Daily Open: 0.7142
Trends:
Daily SMA20: 0.7152
Daily SMA50: 0.7138
Daily SMA100: 0.7162
Daily SMA200: 0.7273
Levels:
Previous Daily High: 0.7149
Previous Daily Low: 0.7079
Previous Weekly High: 0.7149
Previous Weekly Low: 0.7053
Previous Monthly High: 0.7296
Previous Monthly Low: 0.6684
Daily Fibonacci 38.2%: 0.7122
Daily Fibonacci 61.8%: 0.7106
Daily Pivot Point S1: 0.7098
Daily Pivot Point S2: 0.7053
Daily Pivot Point S3: 0.7028
Daily Pivot Point R1: 0.7168
Daily Pivot Point R2: 0.7193
Daily Pivot Point R3: 0.7238
Author

Flavio Tosti
Independent Analyst


