|

AUD/USD technical analysis: Aussie trading at multi-week low as easing and bearish bias is intact

  • Overnight Reserve Bank of Australia (RBA)’s Lowe said that the Bank has an "easing bias." Putting extra pressure on AUD.
  • AUD/USD remains vulnerable to further weakness below the 0.6860 level.
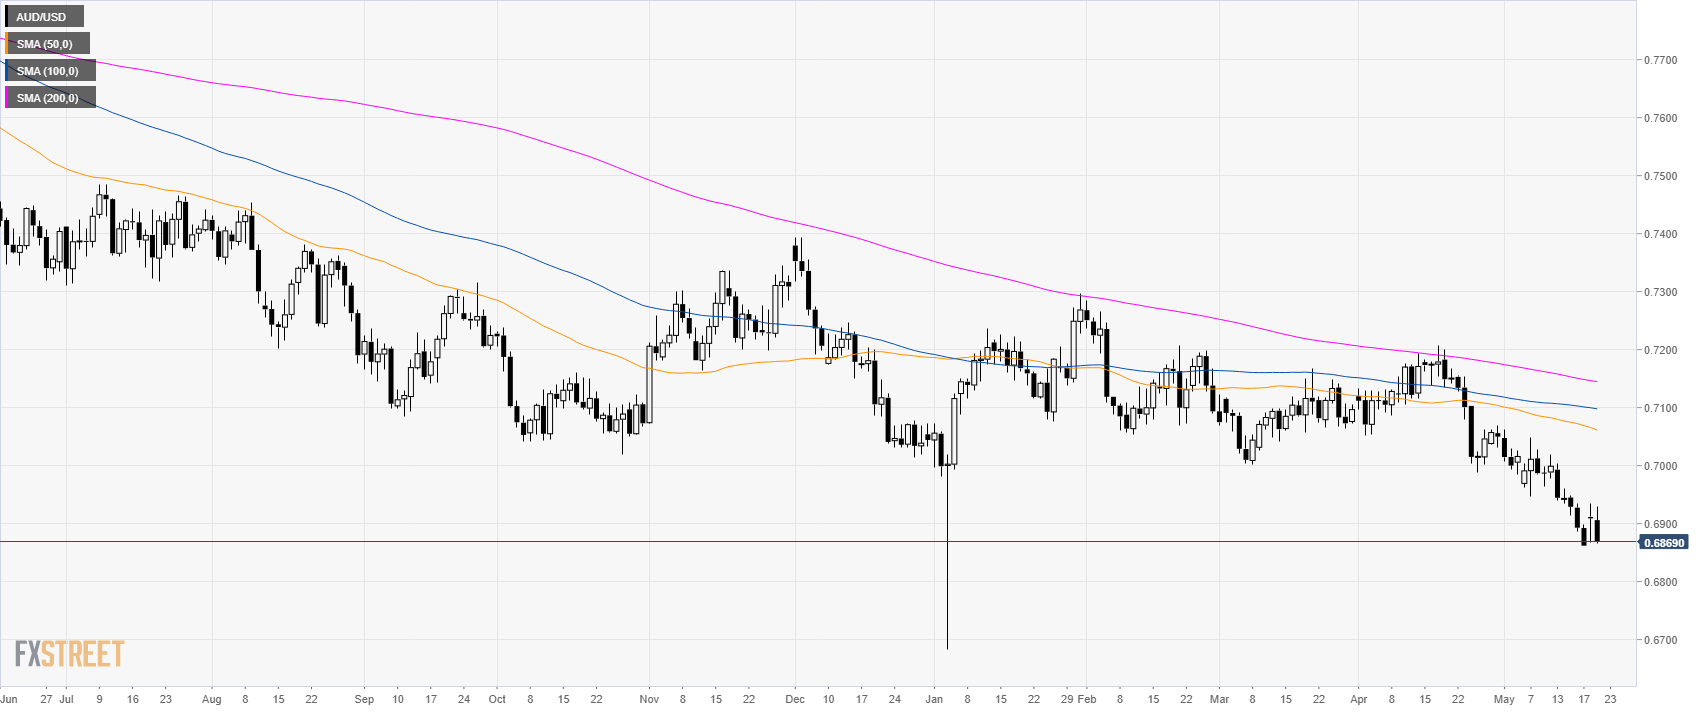
AUD/USD daily chart

AUD/USD is trading in a bear trend below its main simple moving averages (SMAs). The Aussie is trading at multi-month low.

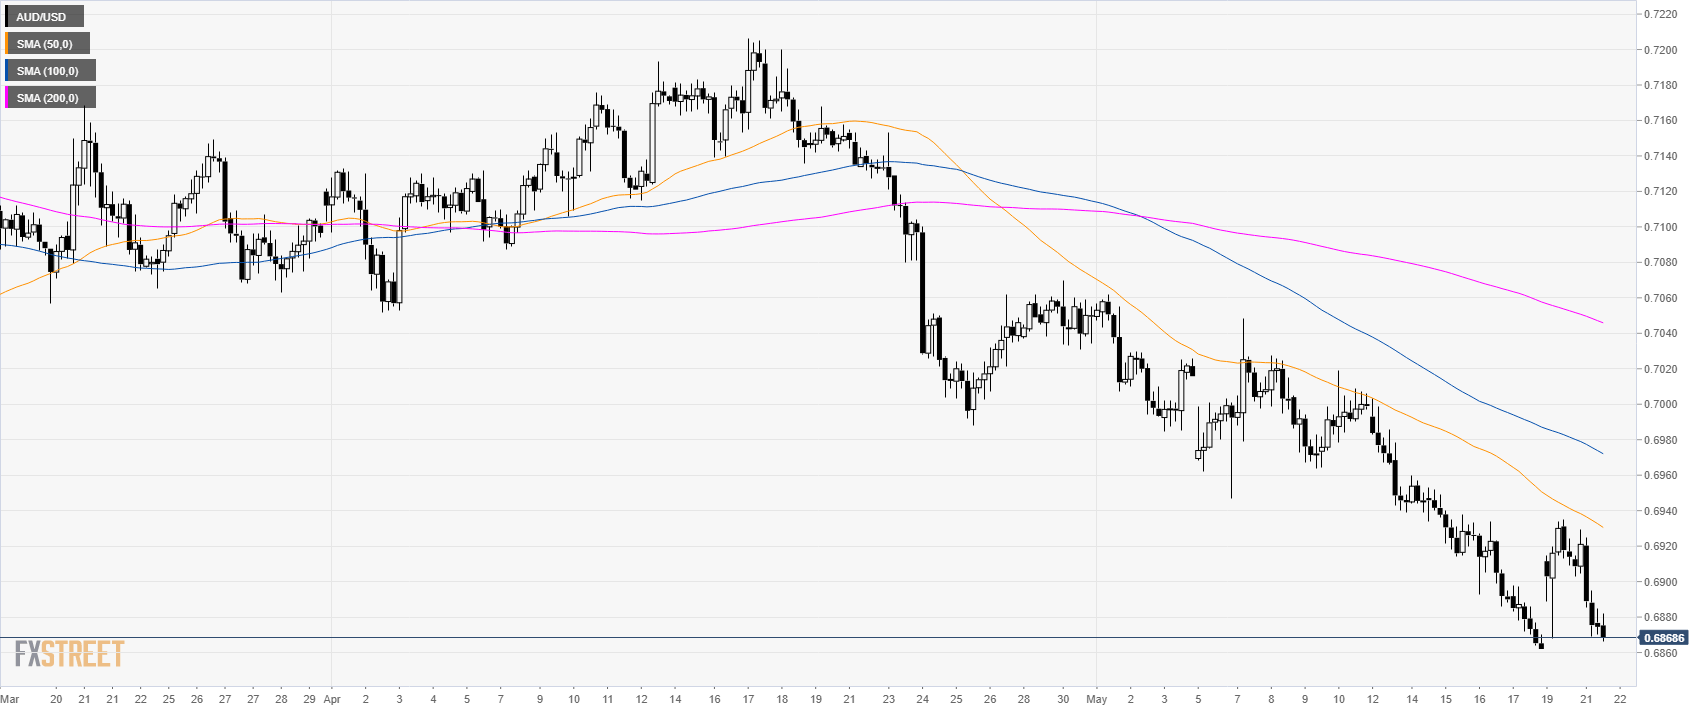
AUD/USD 4-hour chart

AUD/USD is trading at the weekly low its main SMAs suggesting bearish momentum in the medium term.

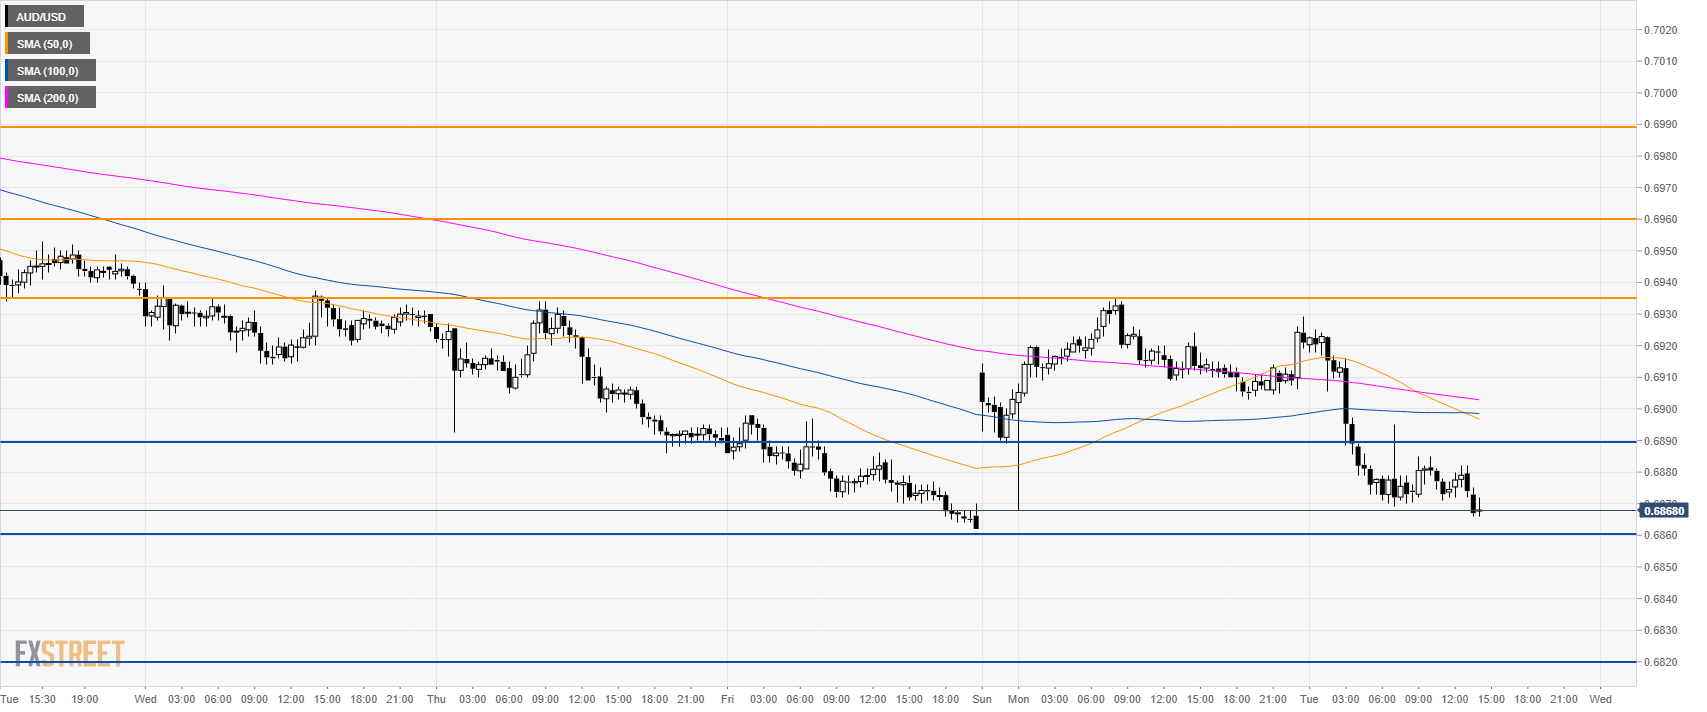
AUD/USD 30-minute chart


The Aussie is pressured near the daily lows. If the bears break below the 0.6860 support they can reach 0.6820 level to the downside. Resistances are seen at 0.6890 and 0.6930 level


Additional key levels

AUD/USD

Overview
Today last price0.6866
Today Daily Change-0.0043
Today Daily Change %-0.62
Today daily open0.6909
 
Trends
Daily SMA200.6989
Daily SMA500.7066
Daily SMA1000.71
Daily SMA2000.7147
Levels
Previous Daily High0.6935
Previous Daily Low0.6868
Previous Weekly High0.7003
Previous Weekly Low0.6862
Previous Monthly High0.7206
Previous Monthly Low0.6988
Daily Fibonacci 38.2%0.6894
Daily Fibonacci 61.8%0.6909
Daily Pivot Point S10.6873
Daily Pivot Point S20.6837
Daily Pivot Point S30.6806
Daily Pivot Point R10.694
Daily Pivot Point R20.6971
Daily Pivot Point R30.7007

Author

Flavio Tosti

Flavio Tosti

Independent Analyst


More from Flavio Tosti
Share:

Editor's Picks

EUR/USD tests nine-day EMA support near 1.1850

EUR/USD inches lower during the Asian hours on Monday, trading around 1.1870 at the time of writing. The 14-day Relative Strength Index momentum indicator at 56 stays above the midline, confirming improving momentum. RSI has cooled from prior overbought readings but stabilizes above 50, suggesting dips could stay limited before buyers reassert control.

GBP/USD flat lines as traders await key UK macro data and FOMC minutes

The GBP/USD pair kicks off a new week on a subdued note and oscillates in a narrow range, just below mid-1.3600s, during the Asian session. Moreover, the mixed fundamental backdrop warrants some caution for aggressive traders as the market focus now shifts to this week's important releases from the UK and the US.

Gold slides below $5,000 amid USD uptick and positive risk tone; downside seems limited

Gold attracts fresh sellers at the start of a new week and reverses a part of Friday's strong move up of over $150 from sub-$4,900 levels. The commodity slides back below the $5,000 psychological mark during the Asian session, though the downside potential seems limited amid a combination of supporting factors.

Bitcoin, Ethereum and Ripple consolidate within key ranges as selling pressure eases

Bitcoin and Ethereum prices have been trading sideways within key ranges following the massive correction. Meanwhile, XRP recovers slightly, breaking above the key resistance zone. The top three cryptocurrencies hint at a potential short-term recovery, with momentum indicators showing fading bearish signs.

Global inflation watch: Signs of cooling services inflation

Realized inflation landed close to expectations in January, as negative base effects weighed on the annual rates. Remaining sticky inflation is largely explained by services, while tariff-driven goods inflation remains limited even in the US.

Ripple Price Forecast: XRP potential bottom could be in sight

Ripple edges up above the intraday low of $1.35 at the time of writing on Friday amid mixed price actions across the crypto market. The remittance token failed to hold support at $1.40 the previous day, reflecting risk-off sentiment amid a decline in retail and institutional sentiment.