|
AUD/USD technical analysis: Aussie trades at two-day highs, ignoring DXY strength
- The Aussie is clinging to daily highs above the 0.6900 handle despite USD strength.
- Resistance is seen at the 0.6910 and 0.6931 price levels.

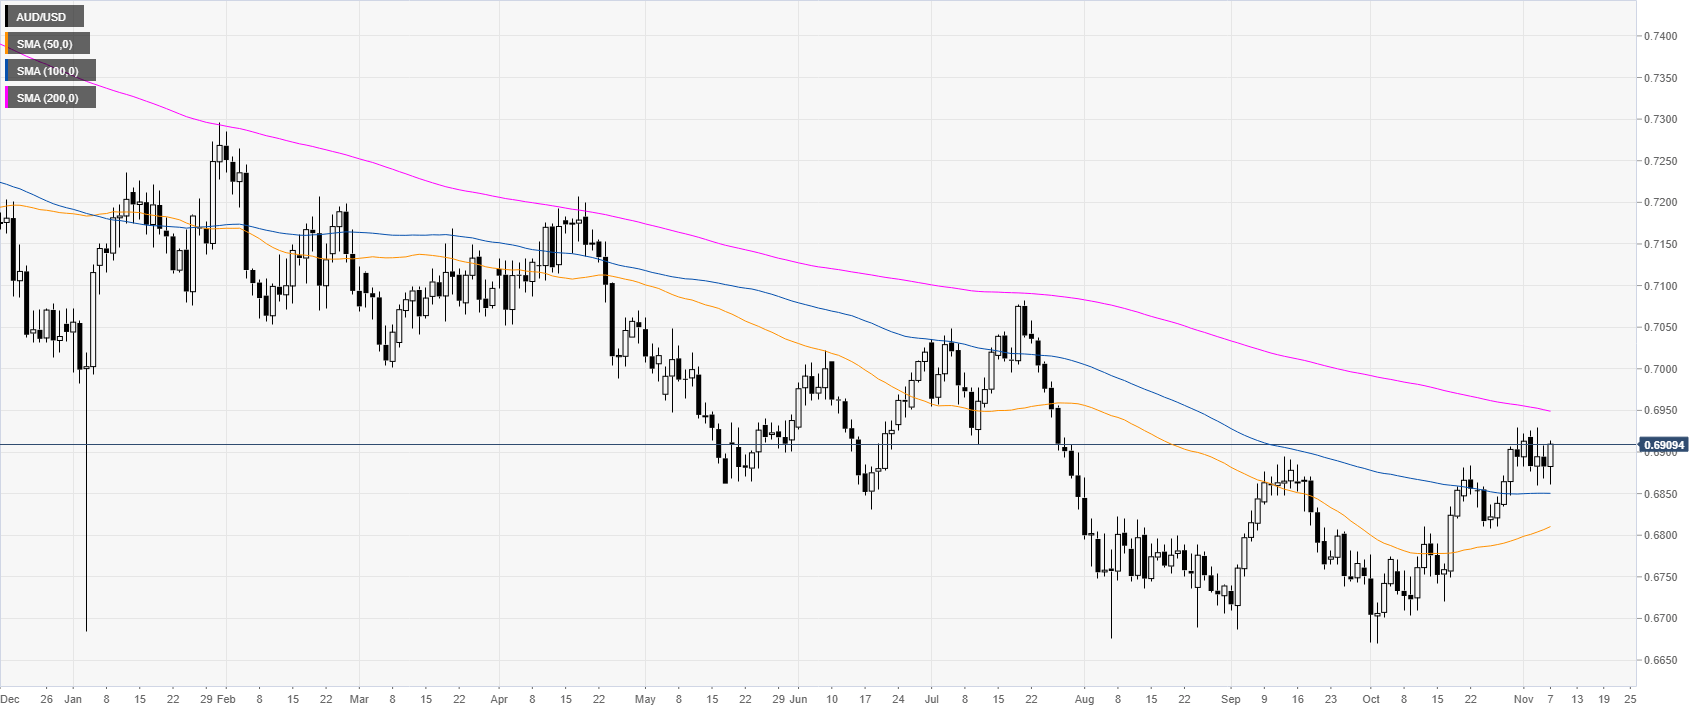
AUD/USD daily chart
The Aussie is trading in a downtrend below its 200-day simple moving average (DMA) on the daily chart. This Thursday the Aussie is holding above the 0.6900 handle despite DXY (US Dollar Index) strength across the board.
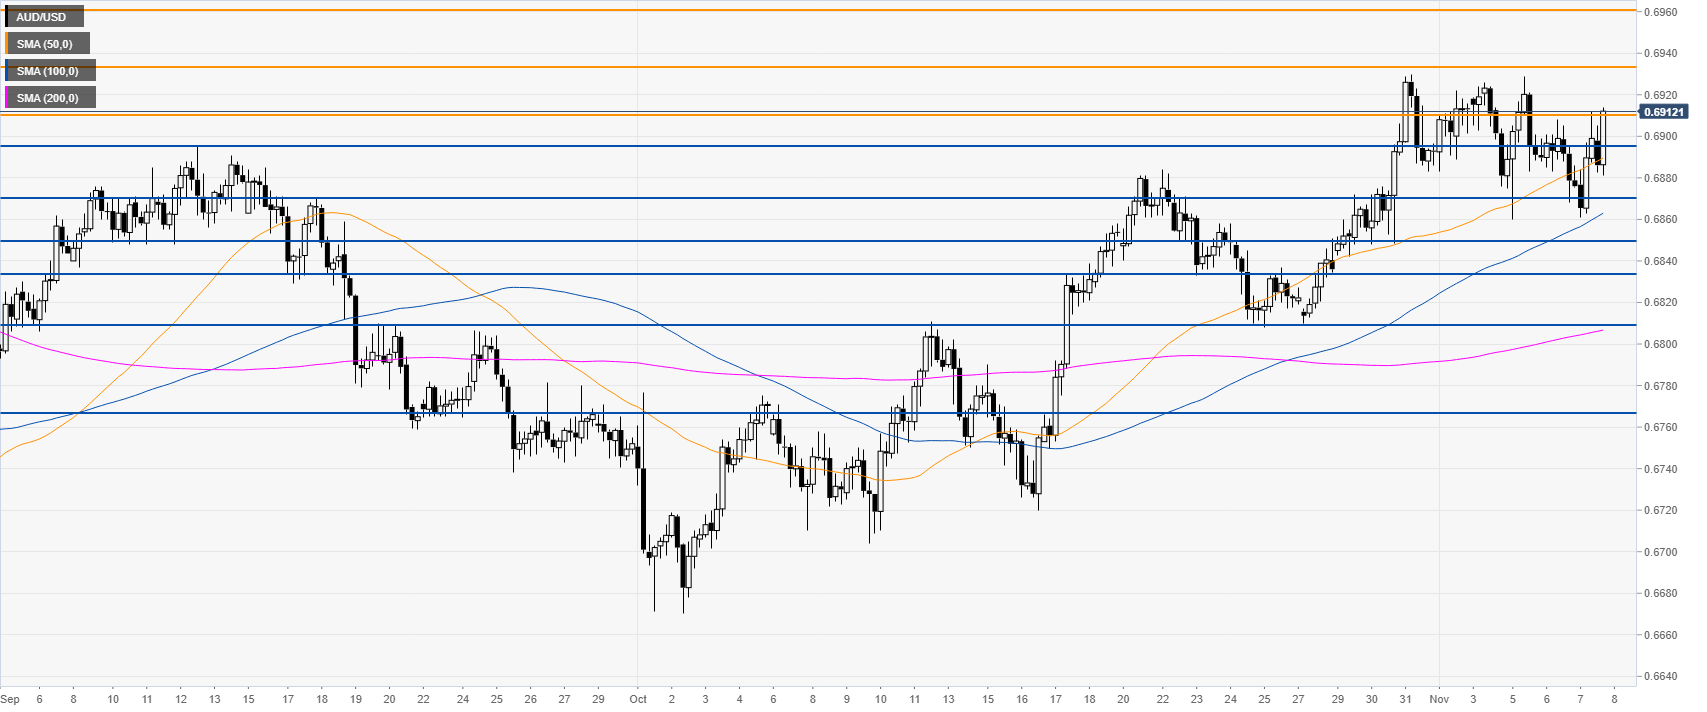
AUD/USD 4-hour chart
The market in November has been consolidating the October rally. However, the Aussie is trading above its main SMAs, suggesting a bullish bias in the medium term. The level to beat for bulls is the 0.6910 resistance which can open the gates to a run to the 0.6931 level, just above the October high. Further up lies the 0.6960 level.
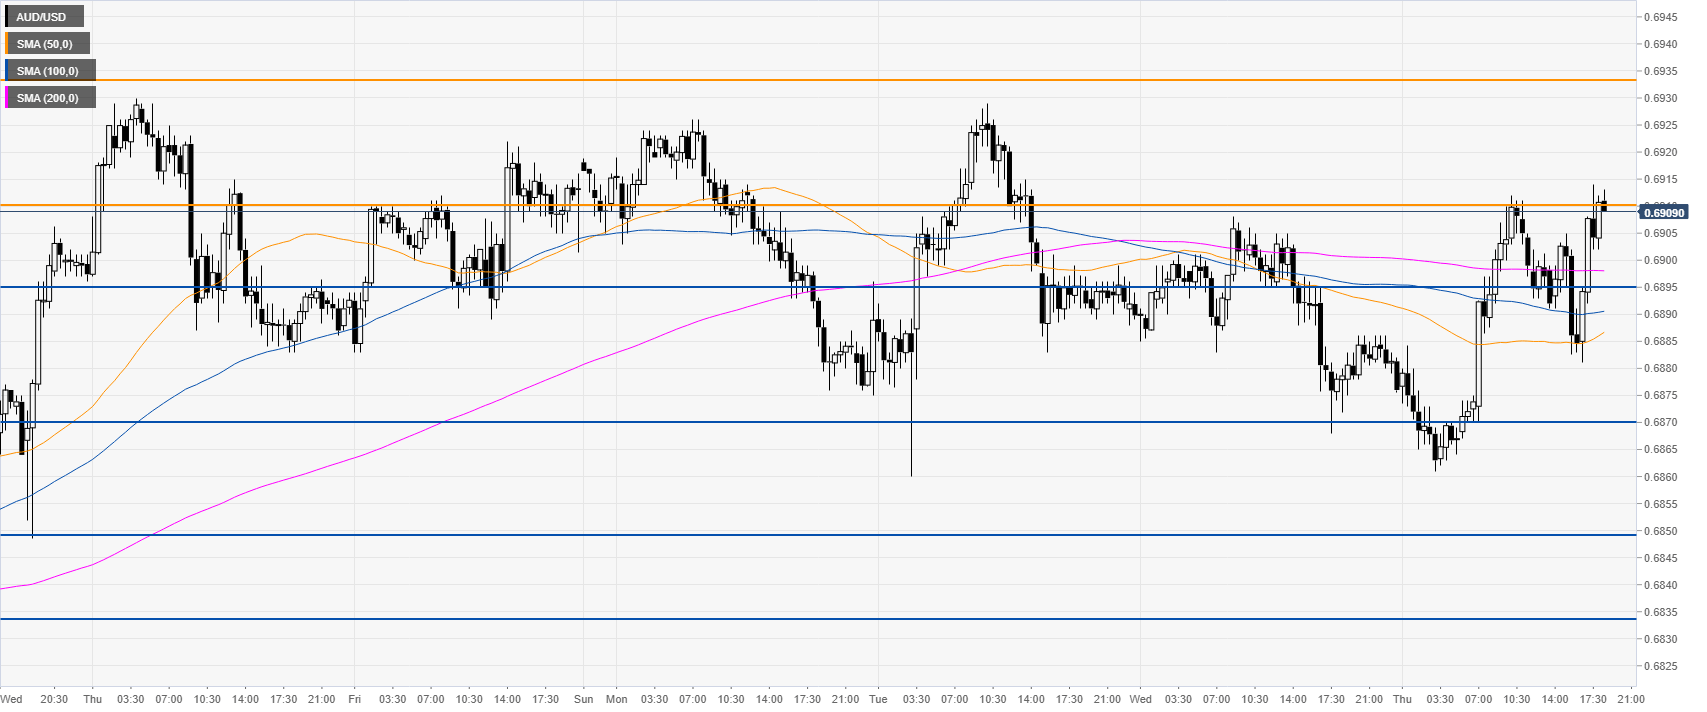
AUD/USD 30-minute chart
AUD/USD is keeping the ranging theme intact this week with intraday swings in both directions. Support is seen at the 0.6885, 0.6870 and 0.6859 price levels, according to the Technical Confluences Indicator.
Additional key levels
Author

Flavio Tosti
Independent Analyst
More from Flavio Tosti


