AUD/USD Technical Analysis: Aussie on the verge of a 150-pip bullish breakout

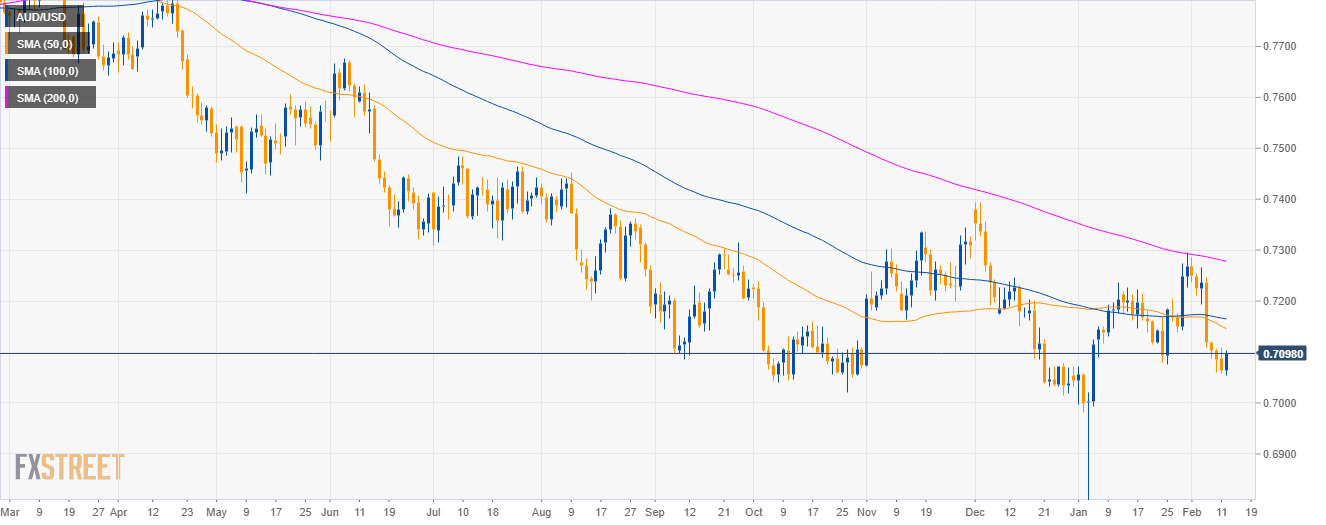
AUD/USD daily chart
- AUD/USD is trading in a bear trend below its main simple moving average (SMAs).
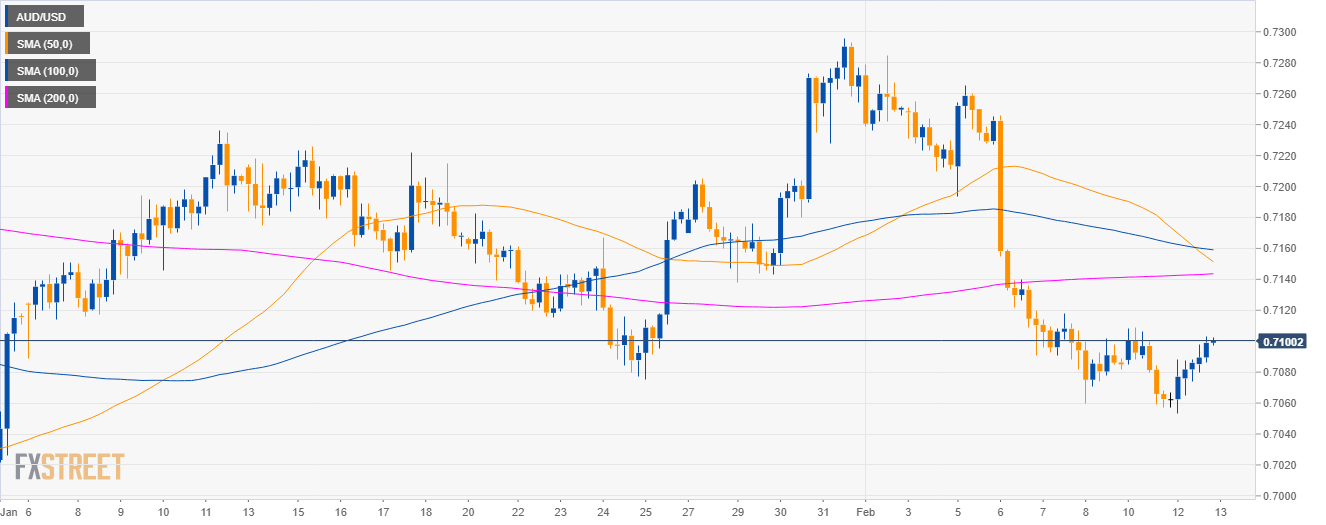
AUD/USD 4-hour chart
- AUD/USD is trading below its main SMAs suggesting bearish momentum in the medium-term.
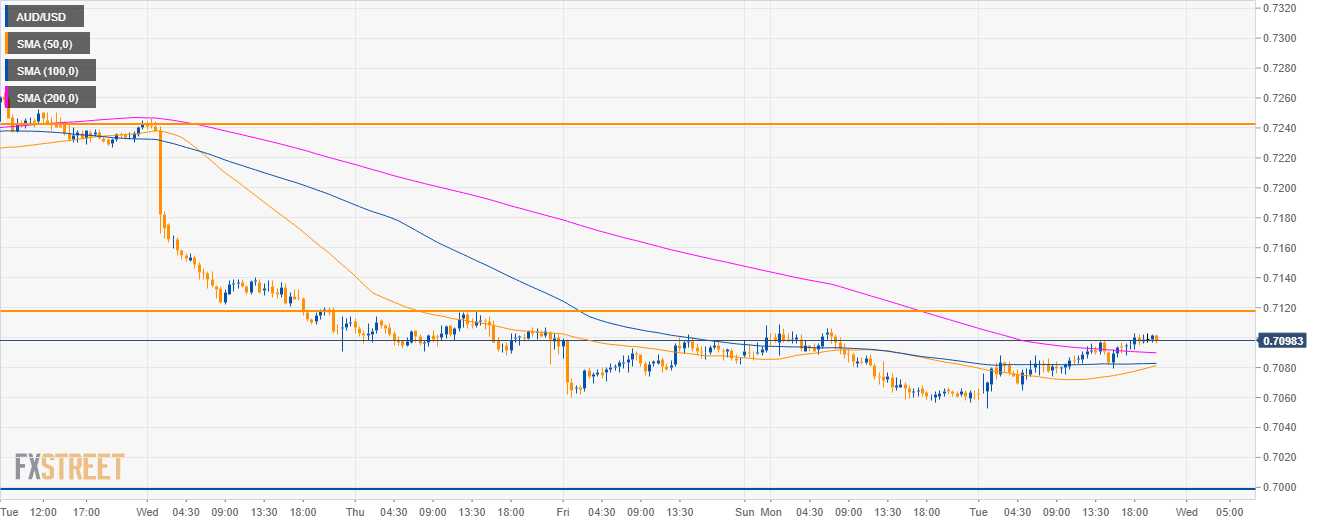
AUD/USD 30-minute chart
- Aussie is trading above its main SMAs suggesting bullish momentum in the short-term.
- Bulls are challenging Monday’s highs and they will need to overcome the 0.7120 resistance in order to travel to 0.7240 potential bullish target.
- On the flip side, the bullish scenario would be invaildated if the market closes below 0.7000 figure.
Additional key levels
AUD/USD
Overview:
Today Last Price: 0.7099
Today Daily change: 35 pips
Today Daily change %: 0.50%
Today Daily Open: 0.7064
Trends:
Daily SMA20: 0.7168
Daily SMA50: 0.7151
Daily SMA100: 0.7167
Daily SMA200: 0.728
Levels:
Previous Daily High: 0.7109
Previous Daily Low: 0.7057
Previous Weekly High: 0.7265
Previous Weekly Low: 0.706
Previous Monthly High: 0.7296
Previous Monthly Low: 0.6684
Daily Fibonacci 38.2%: 0.7077
Daily Fibonacci 61.8%: 0.7089
Daily Pivot Point S1: 0.7044
Daily Pivot Point S2: 0.7025
Daily Pivot Point S3: 0.6992
Daily Pivot Point R1: 0.7096
Daily Pivot Point R2: 0.7129
Daily Pivot Point R3: 0.7148
Author

Flavio Tosti
Independent Analyst


