|
AUD/USD technical analysis: Aussie hits fresh weekly highs, nearing the 0.6900 handle
- AUD/USD is trading at weekly highs.
- The level to beat for bulls is the 0.6890 level.

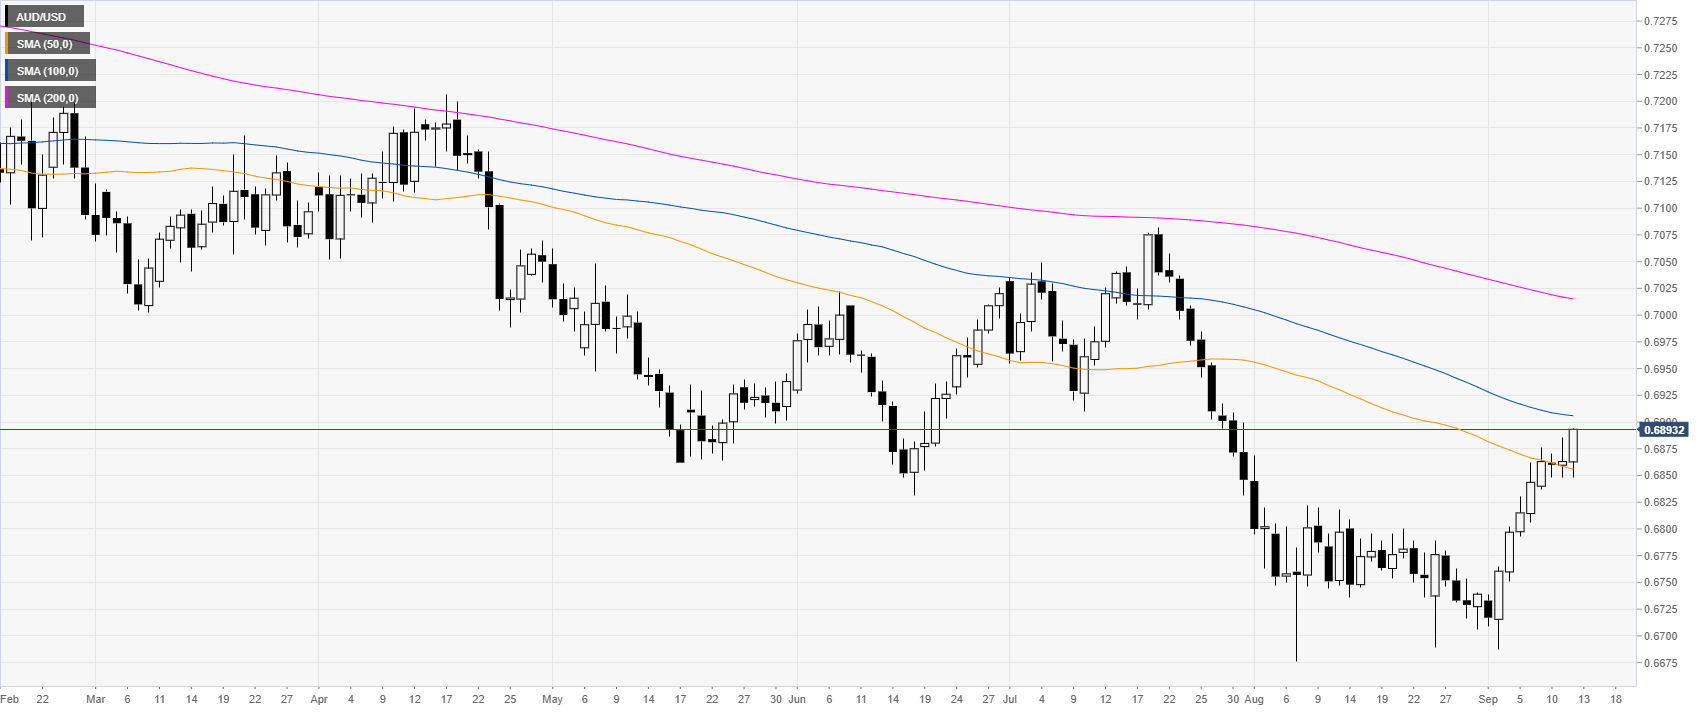
AUD/USD daily chart
The Aussie is trading in a bear trend below its 100 and 200-day simple moving averages (SMAs). However, the market had a sharp rebound in September as the market hit the 50 SMA at the 0.6855 level.
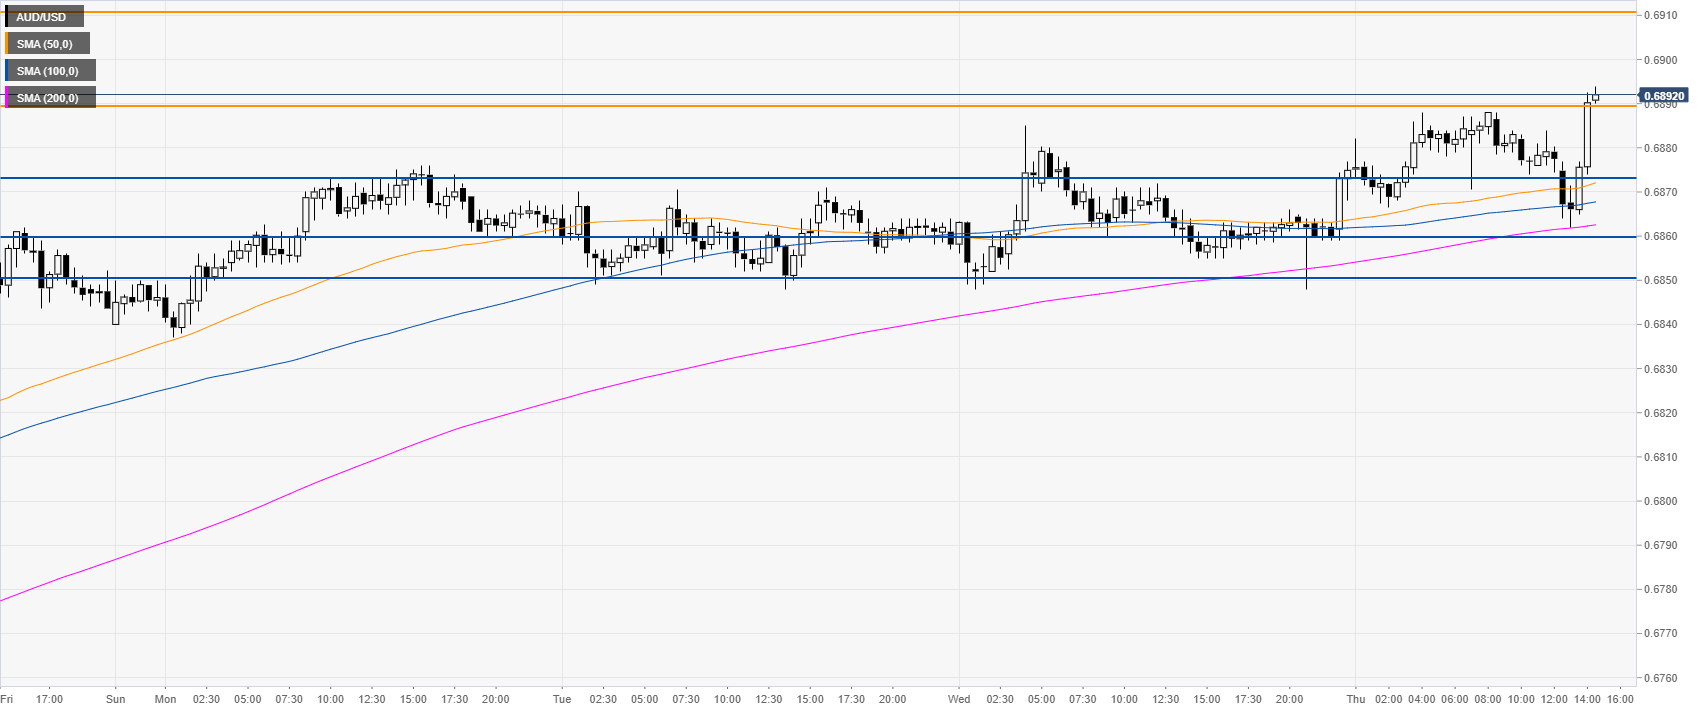
AUD/USD 4-hour chart
The Aussie is trading above its main simple moving averages (SMAs), suggesting bullish momentum in the near term. The market is grinding higher as the bulls are breaking above the 0.6890 level. Further up lie the 0.6910 resistance levels, according to the Technical Confluences Indicator.

AUD/USD 30-minute chart
AUD/USD is rebounding from daily lows and trading at fresh weekly highs as the market trades above its main SMAs. Immediate support is seen at 0.6873, 0.6860 and 0.6850, according to the Technical Confluences Indicator.
Additional key levels
Author

Flavio Tosti
Independent Analyst
More from Flavio Tosti


