|

AUD/USD stuck near 0.6600 ahead of Australian CPI

  • AUD/USD continues to cycle around the 0.6600 handle.
  • Aussie CPI print for Q4 2023 expected to show further inflation easing.
  • US Fed rate call, NFP labor figures to weigh down the rest of the trading week.

AUD/USD cycled in a familiar pattern around the 0.6600 price point on Tuesday as Antipodeans gear up for a fresh print of Australian Consumer Price Index (CPI) inflation figures with the next rate call from the US Federal Reserve (Fed0 in the barrel for Wednesday and US Nonfarm Payrolls (NFP) labor figures slated for Friday.

Australia’s QoQ CPI is expected to ease back to 0.8% from the previous quarter’s 1.2%, and the Reserve Bank of Australia’s (RBA) Trimmed Mean CPI for the annualized fourth quarter is likewise forecast to clip down from 5.2% to 4.3%.

Australia Monthly CPI Preview: Inflation expected to ease further

The heavy-hitters this week revolve around a one-two punch of another Fed rate call and Friday’s US NFP labor print. The Fed is broadly expected to keep rates on hold this week, but cut-hungry investors are having a hard time letting go of bets for a March rate cut, with 44% of the rate swap market still hoping for a rate cut by March according to the CME’s FedWatch Tool.

This week’s US NFP print is expected to show a slight cooling in US labor markets, with the NFP forecast to come in at 180K in January compared to December’s 216K. Markets have routinely undershot NFP forecasts recently, and a topside upset could see investors suffering a rate tantrum as a stubbornly-healthy US labor market reduces chances of rate cuts happening sooner rather than later.

AUD/USD technical outlook

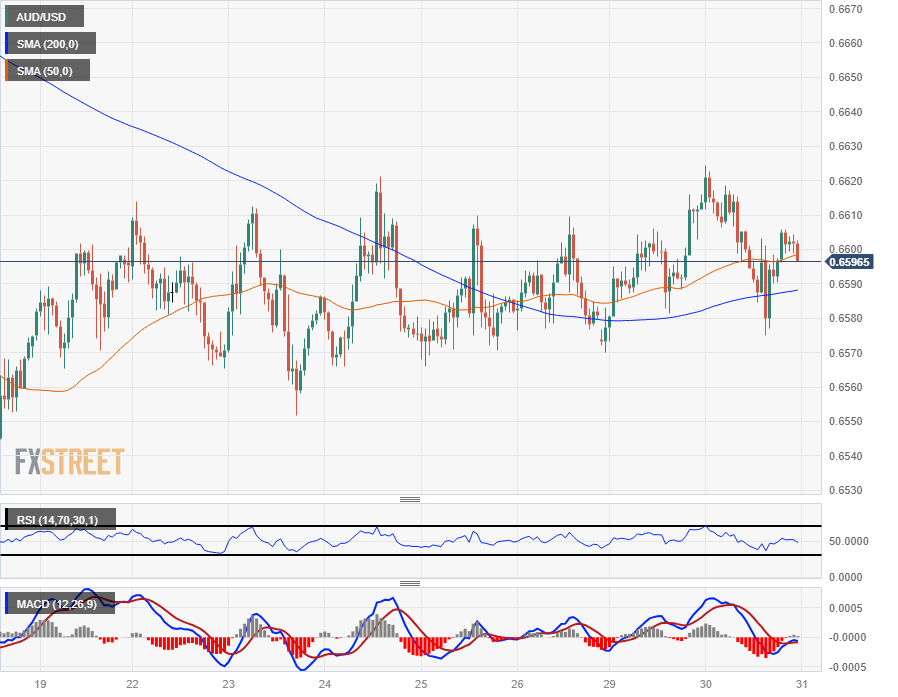
AUD/USD continues to get hung up on the 0.6600 handle, with intraday price action cycling the major price level with near-term momentum getting propped up by a bullish tilt in the 200-hour Simple Moving Average (SMA) rising into 0.6590.

Daily candlesticks remain underpinned by the 200-day SMA at 0.6570, and the AUD/USD is caught in a dense congestion zone between the 50-day and 200-day SMAs as the pair consolidates into the midrange.

AUD/USD Hourly chart
AUD/USD Daily chart

AUD/USD

Overview
Today last price0.6598
Today Daily Change-0.0014
Today Daily Change %-0.21
Today daily open0.6612
 
Trends
Daily SMA200.6642
Daily SMA500.6661
Daily SMA1000.653
Daily SMA2000.6577
 
Levels
Previous Daily High0.6616
Previous Daily Low0.657
Previous Weekly High0.6621
Previous Weekly Low0.6552
Previous Monthly High0.6871
Previous Monthly Low0.6526
Daily Fibonacci 38.2%0.6598
Daily Fibonacci 61.8%0.6588
Daily Pivot Point S10.6582
Daily Pivot Point S20.6553
Daily Pivot Point S30.6537
Daily Pivot Point R10.6628
Daily Pivot Point R20.6645
Daily Pivot Point R30.6674

Author

Joshua Gibson

Joshua joins the FXStreet team as an Economics and Finance double major from Vancouver Island University with twelve years' experience as an independent trader focusing on technical analysis.


More from Joshua Gibson
Share:

Editor's Picks

GBP/USD dips below 1.3350 as USD demand surges

GBP/USD extends its intraday slide and closes in on 1.3300 in the American session on Thursday. The pair remains under heavy bearish pressure as the US Dollar (USD) benefits from the risk-averse market atmosphere amid escalating geopolitical tensions in the Middle East.

EUR/USD drops toward 1.1350 post ECB decision

EUR/USD remains under heavy bearish pressure in the second half of the day on Thursday and trades at its lowest level in three weeks below 1.1370. The ECB's cautious tone on policy tightening in the near future and the broad-based US Dollar (USD) strength on risk-aversion drag the pair lower.

Gold trims gains, dips to $4,050

Gold keeps retreating on Thursday, trading well below $4,100 early in the American session. US crude oil prices climb to a fresh six-week high above $90 amid a further escalation of tensions between the US and Iran, fueling inflation fears and bolstering US Fed interest rate hike expectations. Hawkish Fed bets weigh negatively on the yieldless bullion.

XRP Price Forecast: XRP trades sideways as Ripple targets 10 million agentic AI transactions
Ripple (XRP) is losing momentum on Thursday, albeit gradually, trading above $1.13. The remittance token tagged a weekly high of $1.16 on Tuesday, with gains mainly attributed to developments on the United States (US) Clarity Act and recent signs that inflation is easing in the world’s largest economy.
Bitcoin falls as surging Oil prices revive inflation concerns

Bitcoin extends its correction, trading below $65,800 after a modest decline in the previous day. Despite BTC’s fading strength, US-listed spot Bitcoin Exchange Traded Funds continued to attract institutional inflows on Wednesday, marking the seventh consecutive day of gains.

US Dollar mid-year outlook: Exceptional currency, exceptional risks?
The US Dollar enters the second half of 2026 in a markedly different position from a year ago. The King currency has recovered, reflecting persistent US inflation, changing expectations for Fed policy, geopolitical tensions and renewed demand for defensive assets.















