AUD/USD sees minor losses amid strong US Dollar
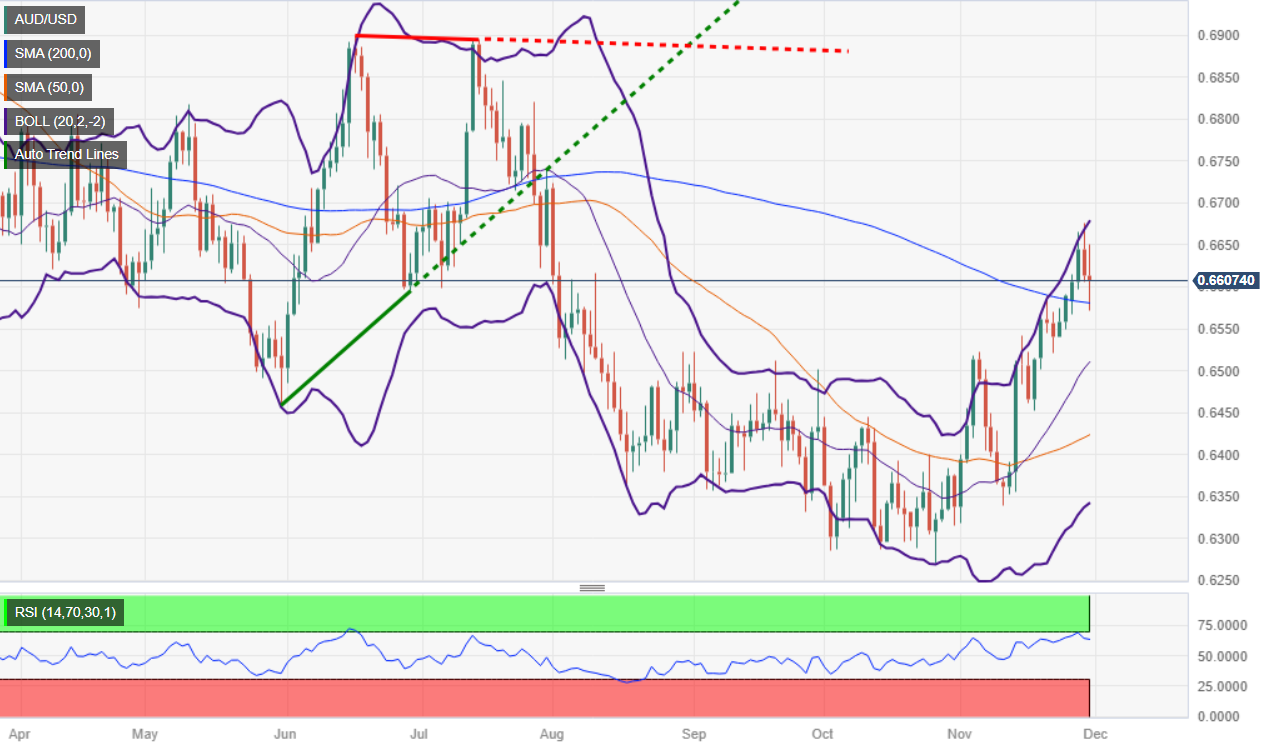
- AUD/USD trades slightly lower, down by 0.06% after bouncing from the 200-day moving average at approximately 0.6579.
- The Fed’s preferred gauge for inflation, core Personal Consumption Expenditures (PCE), slowed as expected.
- Despite signs of cooling inflation, the US Dollar Index (DXY) rises alongside US bond yields.
- In Australia, a weaker inflation report pressures the AUD, even though data shows a surge in business investment.

The AUD/USD is trading with minuscule losses despite being back above the 0.6600 figure after bouncing from the 200-day moving average (DMA) at around 0.6579. Yet, it remains trading in the red, with the pair exchanging hands at around 0.6610s, down by 0.06%.
Australian Dollar struggles for gains against a resurgent US Dollar despite bouncing off key support levels
A busy US economic docket boosted the Greenback (USD) prospects. Firstly, the US Federal Reserve (Fed) preferred gauge for inflation, the core Personal Consumption Expenditures (PCE), jumped by 3.5% YoY as expected and ticked two-tenths lower compared to September’s data. Consequently, headline inflation slowed to the 3.0% threshold for the same period from 3.4%.
Even though inflation is cooling, market participants piled into the Greenback, as the US Dollar Index (DXY) climbed 0.58%, up at 103.44. US bond yields also advanced, with the 10-year benchmark note rising seven basis points to 4.33%.
Other data showed the labor market in the US is easing as well as inflation after the unemployment claims for the last week rose by 218K, exceeding the previous reading of 211K but less than the forecasts. Yesterday, the Beige Book revealed that demand for labor “continued to ease” for several weeks to mid-November. That said, next week’s Nonfarm Payrolls report would be interesting and the last piece of the puzzle that could cement the Fed’s case to end its tightening cycle.
On the Australian front, a softer inflation report on Wednesday weighed on the Aussie Dollar’s (AUD) prospects. Nevertheless, Thursday’s data revealed that business investment soared to an eight-year high in September, even though Chinese data showed that business activity continues to cool down.
AUD/USD Price Analysis: Technical outlook
As the AUD/USD daily chart depicts, the uptrend remains intact, with the pair bouncing off the 0.6571 eight pips below the 200-DMA, which buyers take advantage of to open fresh long positions, as witnessed by price action. Nevertheless, they must keep the exchange rate above 0.6600 so they can threaten to challenge the next resistance at 0.6676, the November 28 high, ahead of the 0.6700 mark. On the other hand, with a daily close below 0.6600, sellers could push the exchange rates toward the 200-DMA.
Author

Christian Borjon Valencia
FXStreet
Markets analyst, news editor, and trading instructor with over 14 years of experience across FX, commodities, US equity indices, and global macro markets.


