|

AUD/USD retreats from weekly tops though stay above the 200-DMA around 0.7320s

  • The AUD/USD failed to gain traction amid a positive market mood.
  • The US Dollar remains firm in the session, a headwind for the AUD/USD pair.
  • AUD/USD Technical Outlook: Upwards above the 200-DMA, but might correct to a 50% Fibonacci level before edging higher.

The Australian dollar is set to end the week on a lower note, despite increased risk appetite on earlier news that Russian President Vladimir Putin claimed that the discussions with Ukraine had taken a positive turn. Reflection of the previous mentioned are European and US equity markets in the green, though in the FX space, the antipodeans extend losses. At the time of writing, the AUD/USD is trading at 0.7326, down 0.45% in the North American session.

In the meantime, the greenback remains firm, at 98..630 up 0.12%, a headwind for the AUD/USD. Furthermore, the rise in US Treasury yields, courtesy of the US central bank getting ready hiking rates, by the March 15-16 meeting.

In the Asian Pacific session, RBA Governor Philip Lowe crossed the wires, and he  “warned borrowers to start preparing for higher interest rates, as surging prices of commodities such as oil, gas and coal heap pressure on the central bank to increase rates to control rising inflation,” per AFR. Lowe added that if the central bank would hike by its June meeting, he said that it was not guaranteed but “it’s plausible.”

Data-wise, an absent Australian docket left AUD/USD leaning in US macro, though next week, inflation in Australia would be reported. On the US front, the University of Michigan Consumer Sentiment declined from 62.8 in February to 59.7, while Inflation expectations rose to 5.4% from 4.9% in the previous reading.

AUD/USD Price Forecast: Technical outlook

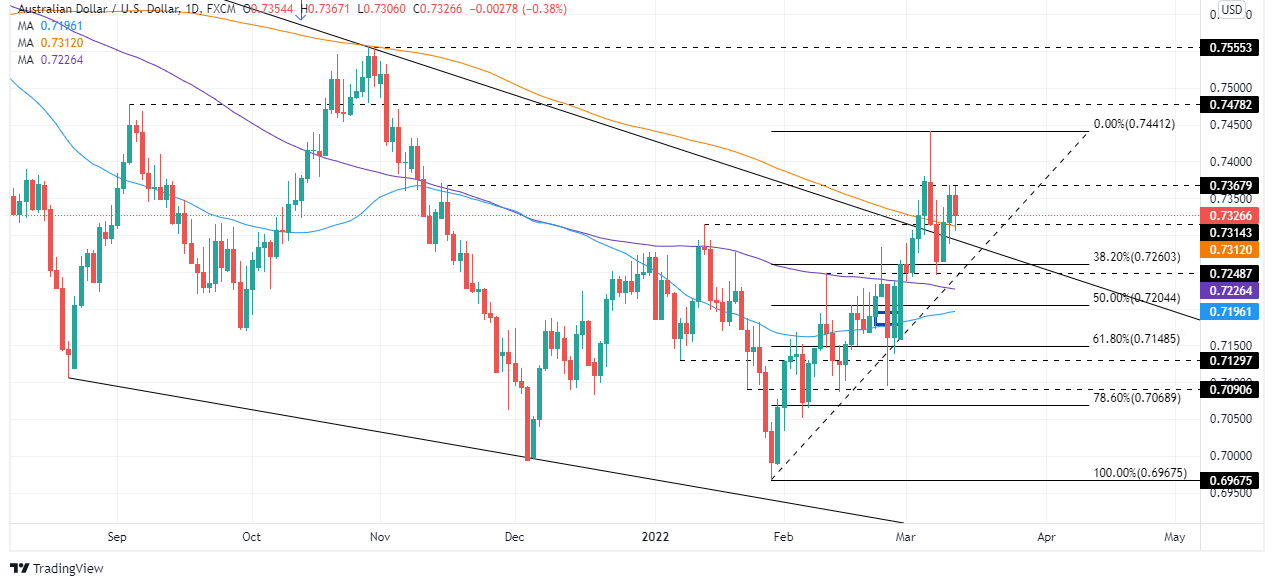
The AUD/USD remains upward biased but clings just above the 200-day moving average (DMA), at 0.7317. Something to be aware of is that Thursday and Friday’s price action is forming a “tweezers-top” candle chart pattern, meaning that a reversal of the rally that began January 28 might correct before resuming upwards.

That said, the AUD/USD first support would be the 200-DMA. Breach of the latter would expose the confluence of the 50-DMA and the 50% Fibonacci level around 0.7196-0.7205 area, followed by the golden ratio (61.8%) at 0.7148.

AUD/USD

Overview
Today last price0.7326
Today Daily Change-0.0032
Today Daily Change %-0.43
Today daily open0.7358
 
Trends
Daily SMA200.724
Daily SMA500.7197
Daily SMA1000.723
Daily SMA2000.7316
 
Levels
Previous Daily High0.7369
Previous Daily Low0.7286
Previous Weekly High0.7381
Previous Weekly Low0.7158
Previous Monthly High0.7286
Previous Monthly Low0.7032
Daily Fibonacci 38.2%0.7337
Daily Fibonacci 61.8%0.7318
Daily Pivot Point S10.7307
Daily Pivot Point S20.7255
Daily Pivot Point S30.7224
Daily Pivot Point R10.7389
Daily Pivot Point R20.742
Daily Pivot Point R30.7472

Author

Christian Borjon Valencia

Christian Borjon began his career as a retail trader in 2010, mainly focused on technical analysis and strategies around it. He started as a swing trader, as he used to work in another industry unrelated to the financial markets.

More from Christian Borjon Valencia
Share:

Markets move fast. We move first.

Orange Juice Newsletter brings you expert driven insights - not headlines. Every day on your inbox.

By subscribing you agree to our Terms and conditions.

Editor's Picks

EUR/USD bears await break below 100-day SMA support near 1.1665 area

The EUR/USD pair attracts heavy selling for the second straight day and dives to a nearly four-week trough, around the 1.1670 region, during the Asian session on Monday. Bearish traders now await a sustained break below the 100-day Simple Moving Average before positioning for an extension of the recent pullback from a three-month top, or levels just above the 1.1800 mark touched on December 24.

GBP/USD falls toward 1.3400 near 50-day EMA

GBP/USD extends its losses for the second successive session, trading around 1.3420 during the Asian hours on Monday. The technical analysis of the daily chart indicates that the 14-day Relative Strength Index at 53 has eased from near overbought, indicating that momentum has cooled while remaining above the midline. RSI holds above 50, keeping a modest bullish bias.

Gold on fire at the start of the week on US-Venezuela tensions

Gold regains upside traction early Monday as flight to safety prevails on Venezuela turmoil. The US Dollar finds strong haven demand, caps Gold’s upside as focus shifts to US jobs data. Gold’s daily technical setup suggests that more upside remains in the offing.

Bulls firmly in control as Bitcoin breaks $93K, Ethereum and Ripple extend gains

Bitcoin, Ethereum, and Ripple extended their rallies on Monday, gaining more than 4%, 6%, and 12%, respectively, in the previous week. The top three cryptocurrencies by market capitalization could continue to outperform, with bulls in control of the momentum.

Economic outlook 2026-2027 in advanced countries: Solidity test

After a year marked by global economic resilience and ending on a note of optimism, 2026 looks promising and could be a year of solid economic performance. In our baseline scenario, we expect most of the supportive factors at work in 2025 to continue to play a role in 2026.

Meme Coins Price Prediction: Dogecoin, Shiba Inu, Pepe rally on Venezuela’s shadow BTC reserve

Meme coins such as Dogecoin, Shiba Inu, and Pepe are leading the cryptocurrency market rally driven by the US cross-border operation to capture Venezuelan President Nicolás Maduro. Dogecoin extends its gain for the fifth consecutive day while SHIB and PEPE take a pause.