AUD/USD Price Forecast: Rises to near 0.6550 after moving slightly above nine-day EMA
- AUD/USD may target the eight-month high of 0.6590.
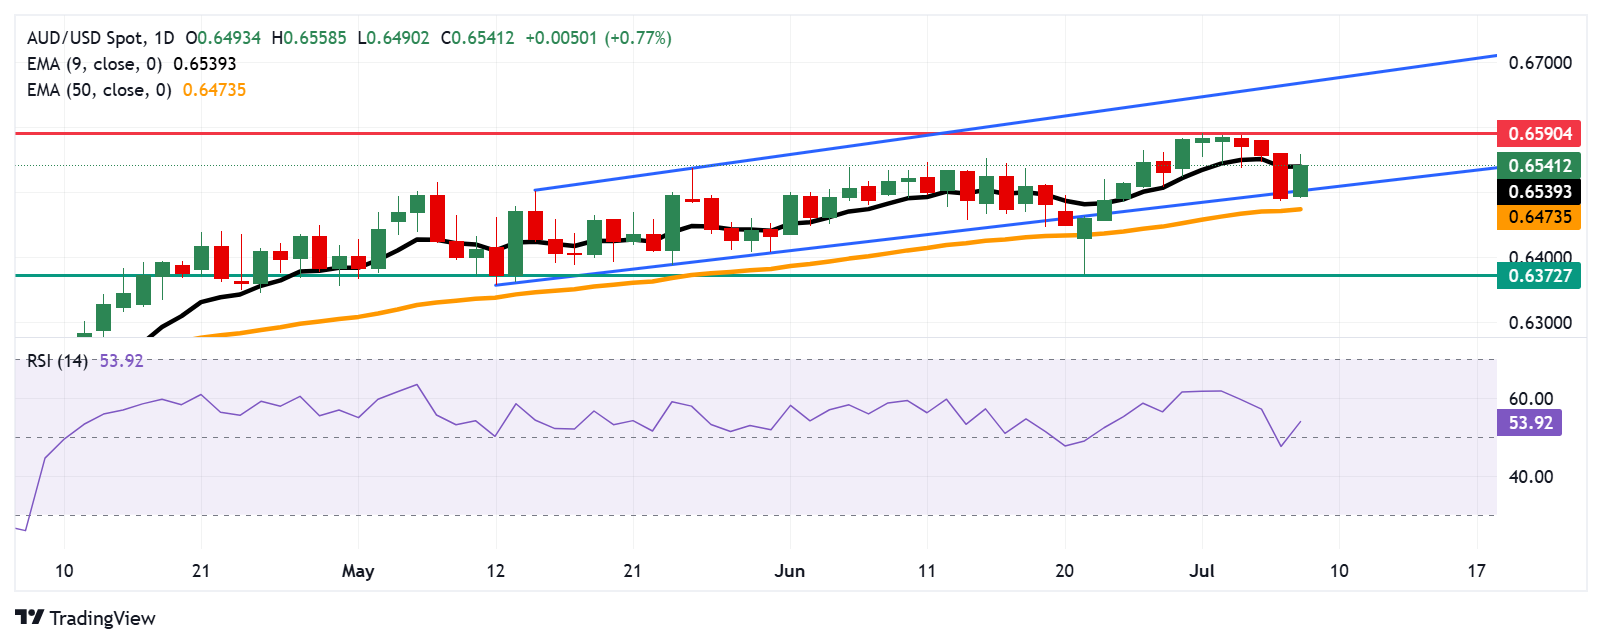
- The RSI moves above the 50 level, suggesting a bullish bias is active.
- The nine-day EMA of 0.6539 is acting as an immediate support.

The AUD/USD pair is recovering its 1% losses registered in the previous session, trading around 0.6540 during the European hours on Tuesday. The daily chart’s technical analysis indicated a renewing bullish sentiment as the pair has rebounded to the existing ascending channel pattern.
Additionally, the 14-day Relative Strength Index (RSI) also moved above the 50 mark, suggesting a bullish bias is active. The pair remains slightly above the nine-day Exponential Moving Average (EMA), suggesting that short-term price momentum is strengthening.
On the upside, the AUD/USD pair may approach the eight-month high of 0.6590, which was recorded on July 1. Further advances would support the pair to explore the region around the upper boundary of the ascending channel around 0.6670.
The AUD/USD pair is testing its immediate support at the nine-day EMA of 0.6539. A break below this level could weaken the short-term price momentum and put the downward pressure on the pair to navigate the region around the ascending channel’s lower boundary at the psychological level of 0.6500, followed by the 50-day EMA at 0.6473. A break below this crucial support zone would dampen the medium-term price momentum and open the doors for the pair to test the two-month low at 0.6372.
AUD/USD: Daily Chart
Australian Dollar PRICE Today
The table below shows the percentage change of Australian Dollar (AUD) against listed major currencies today. Australian Dollar was the strongest against the Japanese Yen.
| USD | EUR | GBP | JPY | CAD | AUD | NZD | CHF | |
|---|---|---|---|---|---|---|---|---|
| USD | -0.30% | -0.01% | 0.09% | -0.25% | -0.72% | -0.31% | -0.23% | |
| EUR | 0.30% | 0.29% | 0.43% | 0.06% | -0.43% | -0.01% | 0.08% | |
| GBP | 0.01% | -0.29% | 0.16% | -0.23% | -0.72% | -0.30% | -0.21% | |
| JPY | -0.09% | -0.43% | -0.16% | -0.36% | -0.84% | -0.37% | -0.24% | |
| CAD | 0.25% | -0.06% | 0.23% | 0.36% | -0.50% | -0.06% | 0.02% | |
| AUD | 0.72% | 0.43% | 0.72% | 0.84% | 0.50% | 0.43% | 0.51% | |
| NZD | 0.31% | 0.00% | 0.30% | 0.37% | 0.06% | -0.43% | 0.09% | |
| CHF | 0.23% | -0.08% | 0.21% | 0.24% | -0.02% | -0.51% | -0.09% |
The heat map shows percentage changes of major currencies against each other. The base currency is picked from the left column, while the quote currency is picked from the top row. For example, if you pick the Australian Dollar from the left column and move along the horizontal line to the US Dollar, the percentage change displayed in the box will represent AUD (base)/USD (quote).
Author

Akhtar Faruqui
FXStreet
Akhtar Faruqui is a Forex Analyst based in New Delhi, India. With a keen eye for market trends and a passion for dissecting complex financial dynamics, he is dedicated to delivering accurate and insightful Forex news and analysis.


