|

AUD/USD Price Forecast: Breaks out of range and follows through to the upside

  • AUD/USD breaks out of the top of a range and rallies. 
  • It has reached an initial bullish target and there is a risk it could soon pull back.  

AUD/USD breaks above its range highs and follows through to the upside on Friday. 

It is in a short-term uptrend which given the principle that “the trend is your friend” is more likely to extend than not. 

AUD/USD Daily Chart 
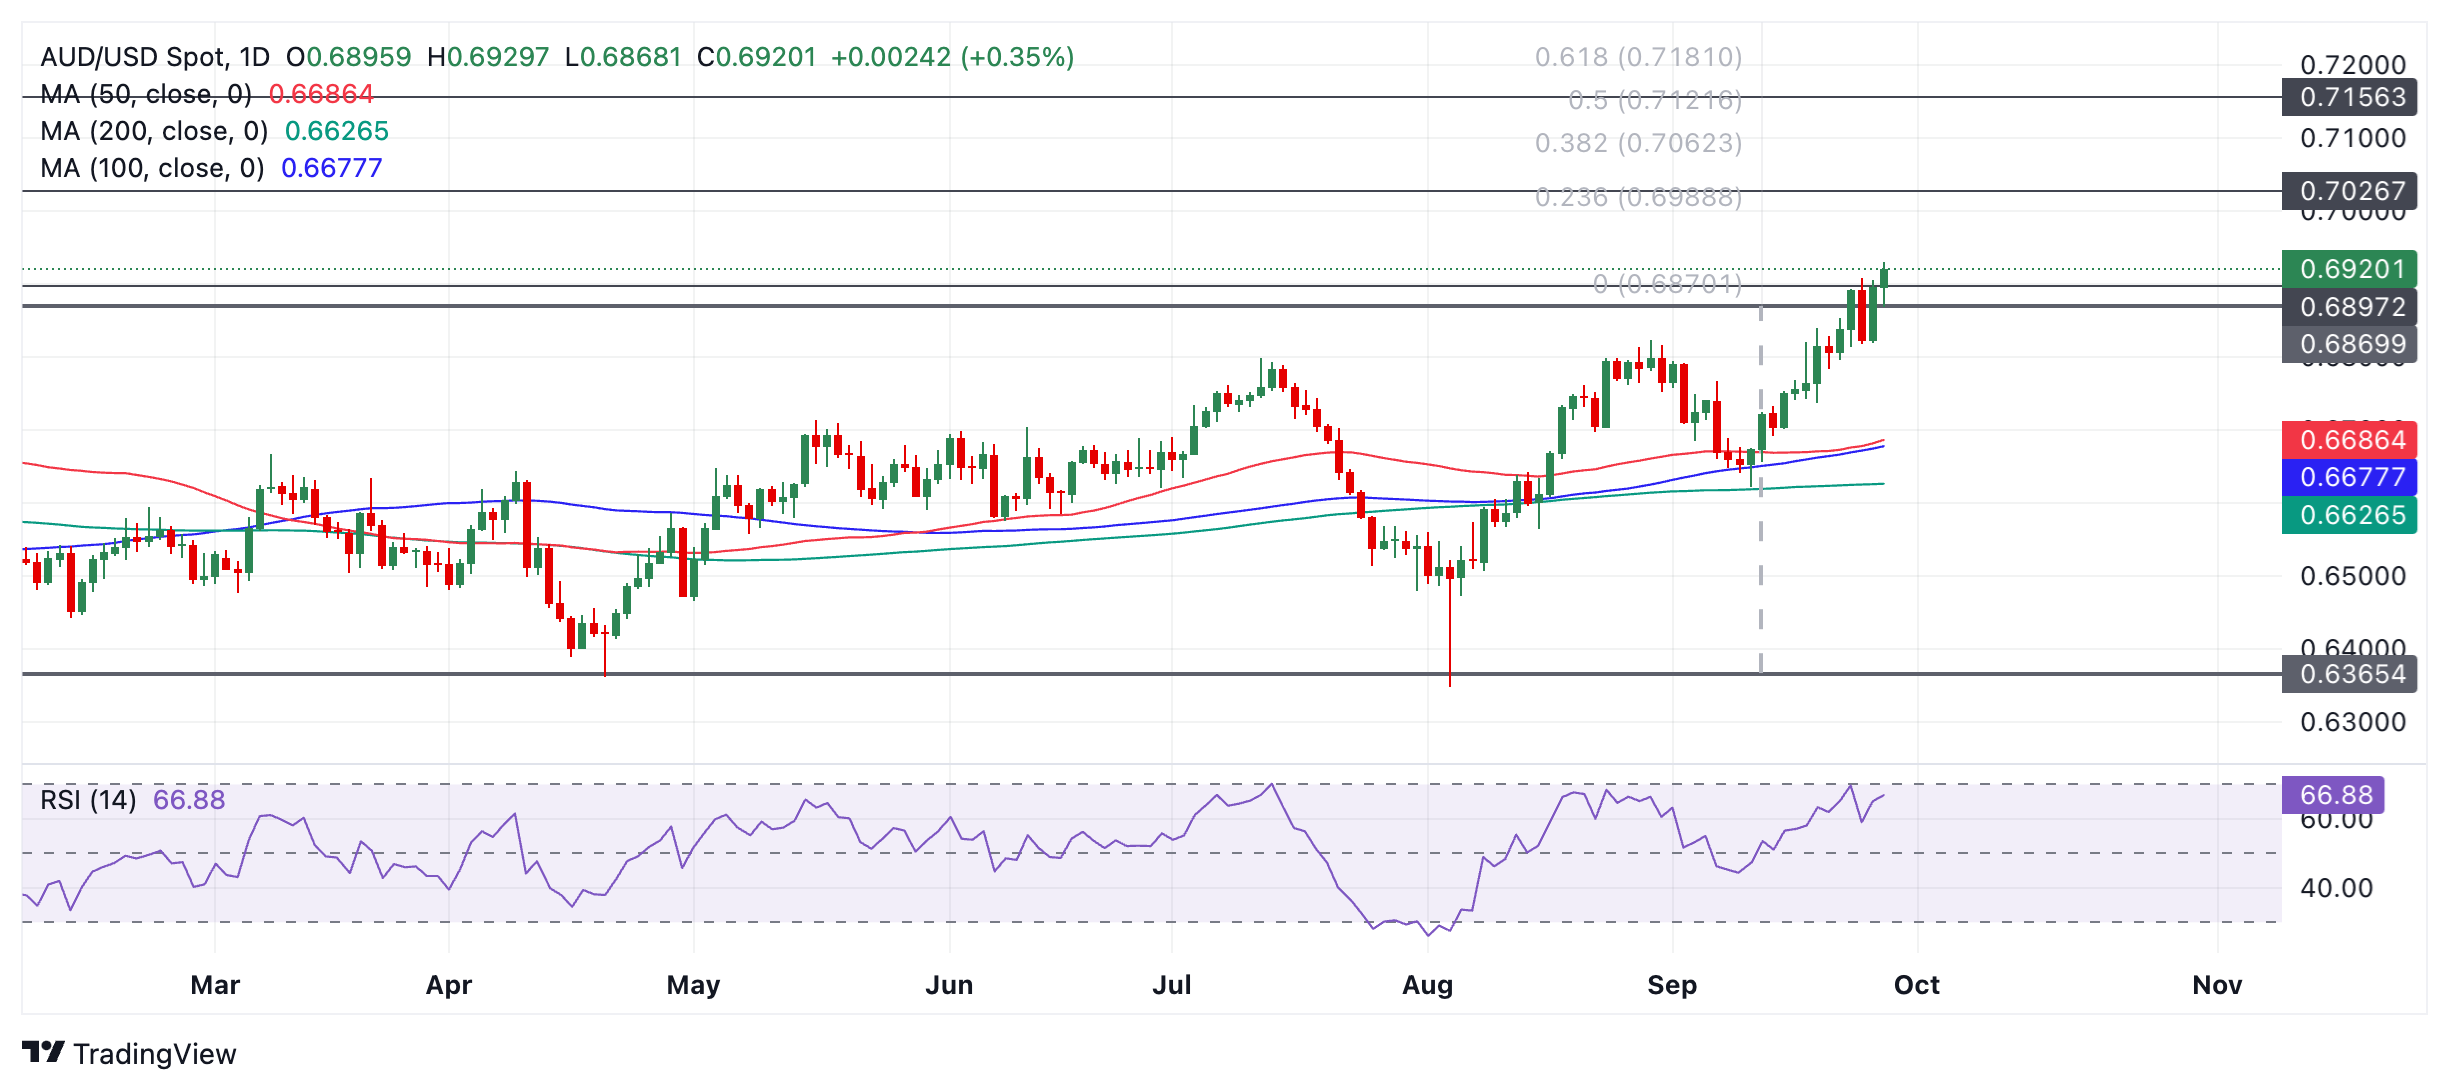
The next target to the upside is 0.6988 (14 February ‘23 swing high), followed by 0.7156 in a bullish case (2 February ‘23 high). 

The pair is not overbought according to the Relative Strength Index (RSI) momentum indicator and so has breadth for more upside. 

AUD/USD has reached an initial upside target based on extrapolating the August rally from the base of the early September correction, higher by a 61.8% Fibonacci. This target lies at around 0.6115 and has already been surpassed. This could indicate the trend has no higher to go and the pair will pull back. There are no signs yet from price action that this is about to occur.

Author

Joaquin Monfort

Joaquin Monfort is a financial writer and analyst with over 10 years experience writing about financial markets and alt data. He holds a degree in Anthropology from London University and a Diploma in Technical analysis.


More from Joaquin Monfort
Share:

Editor's Picks

AUD/USD sits at two-month lows near 0.6950 after Australian CPI data

AUD/USD is sitting at two-month lows near 0.6950 in the Asian session on Wednesday, as below-expectations August Australian underlying CPI data pours cold water on expectations for further RBA interest rate hikes. Chinese PMI data also fail to inspire the Australian Dollar, despite a pause in the US Dollar advance.

USD/JPY stays weak below 157.00 amid Japanese intervention risks

USD/JPY keeps losses below 157.00 in the Asian session on Wednesday, as hawkish BoJ expectations, along with intervention risks, underpin the Japanese Yen, countering dismal domestic factory output and retail sales data. Meanwhile, a broad US Dollar retreat also collaborates to the pair's downside.

Gold flat lines below $4,200, ahead of US inflation data

Gold extends its consolidative price move in the European session, trading near the $4,200 mark. Falling US bond yields drag the US Dollar away from the two-month high, touched on Tuesday, and act as a tailwind for the commodity. However, hawkish US Federal Reserve expectations cap the upside as traders await important US macro data before placing fresh directional bets on the non-yielding bullion.

Crypto Today: Bitcoin holds $83K as Ethereum remains below $2,700 and XRP consolidates

Bitcoin trades lethargically on Wednesday, with bulls battling to defend the immediate $83,000 level as immediate support. Ethereum trades in tandem with Bitcoin, holding below key levels of $2,700 on the upside and $2,600 on the downside. Ripple, meanwhile, hovers near $1.50,

Germany annual CPI inflation rises to 3.3% in September

Inflation in Germany, as measured by the change in the Consumer Price Index, climbed to 3.3% (preliminary) in September from 2.9% in August, Germany's Destatis reported on Wednesday.

Silver is more volatile than Gold ahead of PCE and NFP. This chart shows the positioning gap
The market’s attention is focused on American data this week, but there’s something only those with a trained eye may be looking at: Gold and Silver positioning gap. Financial markets are moving on fears, mostly related to persistently high energy prices driven by the Middle East war. Sure, the US Dollar (USD) is strong, but at what cost?