AUD/USD Price Analysis: Upside above 0.6700 seems likely as RBA remains hawkish on interest rate guidance


  • AUD/USD is facing barricades in extending its rally above 0.6700, however, the upside bias is still solid.
  • Offers for the USD Index soared dramatically as investors are anticipating a pause in the policy-tightening spell by the Fed.
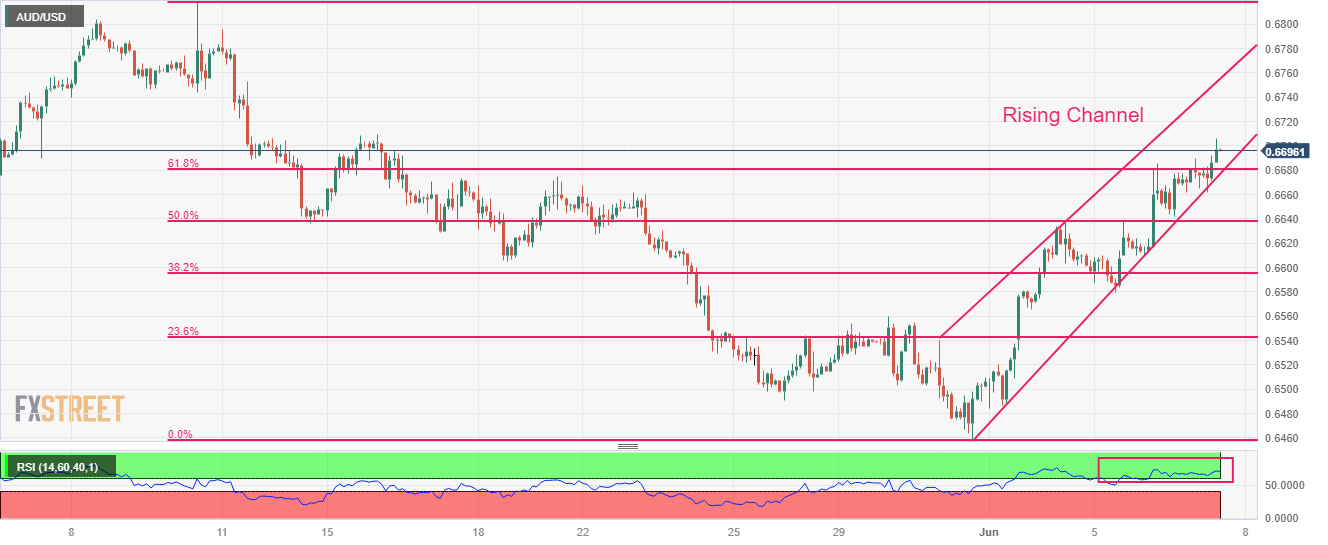
  • AUD/USD is auctioning in a Rising Channel in which each corrective move is considered a buying opportunity.

The AUD/USD pair is struggling in stretching its rally above the round-level resistance of 0.6700 in the early New York session. The Aussie asset is expected to climb above the aforementioned resistance confidently as the Reserve Bank of Australia (RBA) has opened room for further interest rate hikes to arrest stubborn Australian inflation.

S&P500 futures have added decent gains ahead of United States opening, portraying an upbeat market mood. The US Dollar Index (DXY) displayed a perpendicular fall after failing to recapture the previous day’s high at 104.30. Offers for the USD Index soared dramatically as investors are anticipating a pause in the policy-tightening spell by the Federal Reserve (Fed).

As per the CME Fedwatch tool, the chances of a neutral interest rate policy have jumped above 77%.

AUD/USD is auctioning in a Rising Channel on a two-hour scale in which each corrective move is considered as a buying opportunity by the market participants. The Aussie asset has comfortably shifted above the 61.8% Fibonacci retracement (plotted from May 10 high at 0.6818 to May 31 low at 0.6458) at 0.6682.

The Relative Strength Index (RSI) is oscillating in the bullish range of 60.00-80.00, indicating more upside ahead.

Should the Aussie asset confidently breaks above the round-level resistance of 0.6700, the Australian Dollar bulls will drive the asset toward April 18 high at 0.6748 followed by May 10 high at 0.6818.

On the flip side, if the Aussie asset breaks below June 01 low at 0.6484, US Dollar bulls would drag the asset to 01 November 2022 high around 0.6464 followed by the round-level support at 0.6400.

AUD/USD two-hour chart

AUD/USD

Overview
Today last price 0.669
Today Daily Change 0.0018
Today Daily Change % 0.27
Today daily open 0.6672
 
Trends
Daily SMA20 0.6613
Daily SMA50 0.6662
Daily SMA100 0.6748
Daily SMA200 0.6692
 
Levels
Previous Daily High 0.6685
Previous Daily Low 0.661
Previous Weekly High 0.6639
Previous Weekly Low 0.6458
Previous Monthly High 0.6818
Previous Monthly Low 0.6458
Daily Fibonacci 38.2% 0.6656
Daily Fibonacci 61.8% 0.6639
Daily Pivot Point S1 0.6626
Daily Pivot Point S2 0.658
Daily Pivot Point S3 0.655
Daily Pivot Point R1 0.6702
Daily Pivot Point R2 0.6731
Daily Pivot Point R3 0.6777


Share: Feed news

Information on these pages contains forward-looking statements that involve risks and uncertainties. Markets and instruments profiled on this page are for informational purposes only and should not in any way come across as a recommendation to buy or sell in these assets. You should do your own thorough research before making any investment decisions. FXStreet does not in any way guarantee that this information is free from mistakes, errors, or material misstatements. It also does not guarantee that this information is of a timely nature. Investing in Open Markets involves a great deal of risk, including the loss of all or a portion of your investment, as well as emotional distress. All risks, losses and costs associated with investing, including total loss of principal, are your responsibility. The views and opinions expressed in this article are those of the authors and do not necessarily reflect the official policy or position of FXStreet nor its advertisers. The author will not be held responsible for information that is found at the end of links posted on this page.

If not otherwise explicitly mentioned in the body of the article, at the time of writing, the author has no position in any stock mentioned in this article and no business relationship with any company mentioned. The author has not received compensation for writing this article, other than from FXStreet.

FXStreet and the author do not provide personalized recommendations. The author makes no representations as to the accuracy, completeness, or suitability of this information. FXStreet and the author will not be liable for any errors, omissions or any losses, injuries or damages arising from this information and its display or use. Errors and omissions excepted.

The author and FXStreet are not registered investment advisors and nothing in this article is intended to be investment advice.

Recommended content


Recommended content

Editors’ Picks

EUR/USD retreats below 1.0700 after US GDP data

EUR/USD retreats below 1.0700 after US GDP data

EUR/USD came under modest bearish pressure and retreated below 1.0700. Although the US data showed that the economy grew at a softer pace than expected in Q1, strong inflation-related details provided a boost to the USD.

EUR/USD News

GBP/USD declines below 1.2500 as USD rebounds

GBP/USD declines below 1.2500 as USD rebounds

GBP/USD declined below 1.2500 and erased the majority of its daily gains with the immediate reaction to the US GDP report. The US economy expanded at a softer pace than expected in Q1 but the price deflator jumped to 3.4% from 1.8%. 

GBP/USD News

Gold drops below $2,320 as US yields shoot higher

Gold drops below $2,320 as US yields shoot higher

Gold lost its traction and turned negative on the day below $2,320 in the American session on Thursday. The benchmark 10-year US Treasury bond yield is up more than 1% on the day above 4.7% after US GDP report, weighing on XAU/USD.

Gold News

XRP extends its decline, crypto experts comment on Ripple stablecoin and benefits for XRP Ledger

XRP extends its decline, crypto experts comment on Ripple stablecoin and benefits for XRP Ledger

Ripple extends decline to $0.52 on Thursday, wipes out weekly gains. Crypto expert asks Ripple CTO how the stablecoin will benefit the XRP Ledger and native token XRP. 

Read more

After the US close, it’s the Tokyo CPI

After the US close, it’s the Tokyo CPI

After the US close, it’s the Tokyo CPI, a reliable indicator of the national number and then the BoJ policy announcement. Tokyo CPI ex food and energy in Japan was a rise to 2.90% in March from 2.50%.

Read more

Forex MAJORS

Cryptocurrencies

Signatures