|

AUD/USD Price Analysis: Sellers eye 0.6800 as a bearish-engulfing candle pattern emerges

  • AUD/USD is about to finish the week with losses of 1.10%.
  • A bearish-engulfing candle pattern and the RSI’s crossing below 50 are two reasons that could tumble the AUD/USD.
  • AUD/USD sellers eye a break below 0.6900, on its way towards 0.6800.

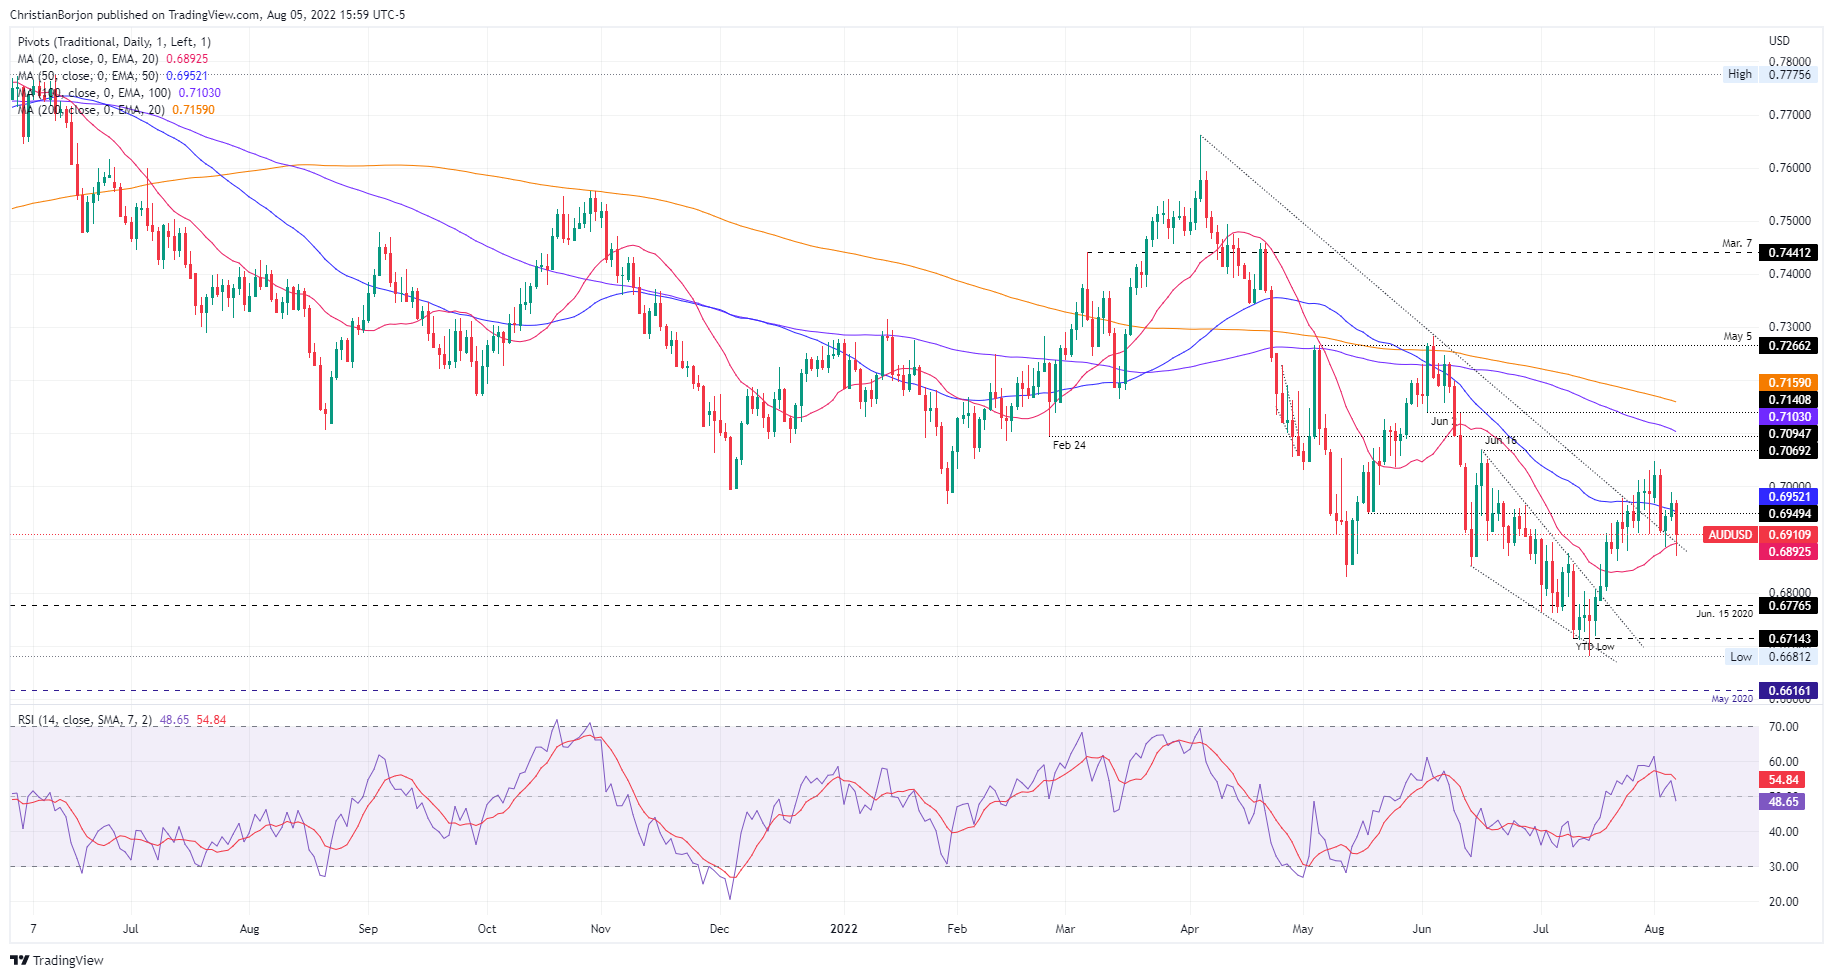
The AUD/USD drops substantially, courtesy of upbeat US economic data, which sent the major plunging from daily highs around 0.6974 towards the day’s lows at 0.6869, though as Wall Street closed, the Aussie trimmed some of those losses. At the time of writing, the AUD/USD is trading at 0.6910, down 0.82%.

AUD/USD Price Analysis: Technical outlook

The AUD/USD daily chart portrays the pair below the confluence of the August 4 low and the 50-day EMA around 0.6952. It’s worth noting that earlier, the major dived below the intersection of a five-month-old downslope trendline and the 20-day EMA, around 0.6892, but it was short-lived and bounced toward current exchange rates.

Still, the AUD/USD is downward biased for some reasons: first,  the Relative Strength Index (RSI) just crossed below the 50-midline, indicating sellers are gathering momentum. And the second reason would be that the last two-daily candles formed a bearish-engulfing candle pattern, implying that sellers outweighed buyers.

Therefore, the AUD/USD path of least resistance is downwards, and the pair’s first support would be the 0.6900 figure. Once cleared, the next stop will be the 20-day EMA at 0.6892, followed by the 0.6800 mark.

AUD/USD Key Technical Levels

AUD/USD

Overview
Today last price0.6910
Today Daily Change-0.0082
Today Daily Change %-1.18
Today daily open0.697
 
Trends
Daily SMA200.6892
Daily SMA500.696
Daily SMA1000.7111
Daily SMA2000.7164
 
Levels
Previous Daily High0.6991
Previous Daily Low0.6934
Previous Weekly High0.7033
Previous Weekly Low0.6879
Previous Monthly High0.7033
Previous Monthly Low0.668
Daily Fibonacci 38.2%0.6969
Daily Fibonacci 61.8%0.6956
Daily Pivot Point S10.6939
Daily Pivot Point S20.6909
Daily Pivot Point S30.6883
Daily Pivot Point R10.6996
Daily Pivot Point R20.7022
Daily Pivot Point R30.7052

Author

Christian Borjon Valencia

Markets analyst, news editor, and trading instructor with over 14 years of experience across FX, commodities, US equity indices, and global macro markets.

More from Christian Borjon Valencia
Share:

Editor's Picks

EUR/USD shifts its attention to 1.1900 and above

EUR/USD has shaken off Tuesday’s dip, pushing back beyond the 1.1800 mark amid decent gains as  Wednesday’s session draws to a close. The rebound is largely driven by a modest pullback in the US Dollar, as markets digest the aftermath of President Trump’s SOTU speech and continue to monitor trade-related headlines and signals from the White House.
 

GBP/USD challenges multi-day highs near 1.3530

GBP/USD leaves behind the previous day’s decline and regains fresh upside traction on Wednesday, surpassing the 1.3500 barrier in a context of a modest decline in the Greenback and a generalised improved mood in the risk-linked space. Meanwhile, the US tariff narrative continues to dictate the mood among market participants after Presidet Trump’s SOTU speech failed to surprise markets.

Gold remains bid and close to $5,200

Gold buyers are returning to the fold on Wednesday, targeting the $5,200 area and possibly beyond, after Tuesday’s corrective dip from monthly highs. The rebound in the precious metal comes as the US Dollar loses traction, with Trump’s SOTU speech offering little fresh direction and AI-related nerves continuing to ease.

UK financial watchdog advances stablecoin oversight as four firms pilot issuance

The Financial Conduct Authority (FCA) in the United Kingdom (UK) is advancing toward the final stablecoin regulatory framework with a pilot program involving four companies, including Monee, Financial Technologies ReStabilise, Revolut and VVTX.

Nvidia earnings to influence AI trade and broader market sentiment

For the last three years, Nvidia has been the engine of the AI boom, and now Wall Street is watching to see whether that momentum can keep going. High-growth stocks have been struggling to maintain their bullish trend in 2026.

Cosmos Hub Price Forecast: ATOM rebounds slightly, bearish outlook remains intact

Cosmos Hub (ATOM) price rebounds, trading above $2.05 at the time of writing on Wednesday, after undergoing a sharp correction since last week. Weakening on-chain and derivatives data support a bearish outlook, while technical analysis remains unfavorable.