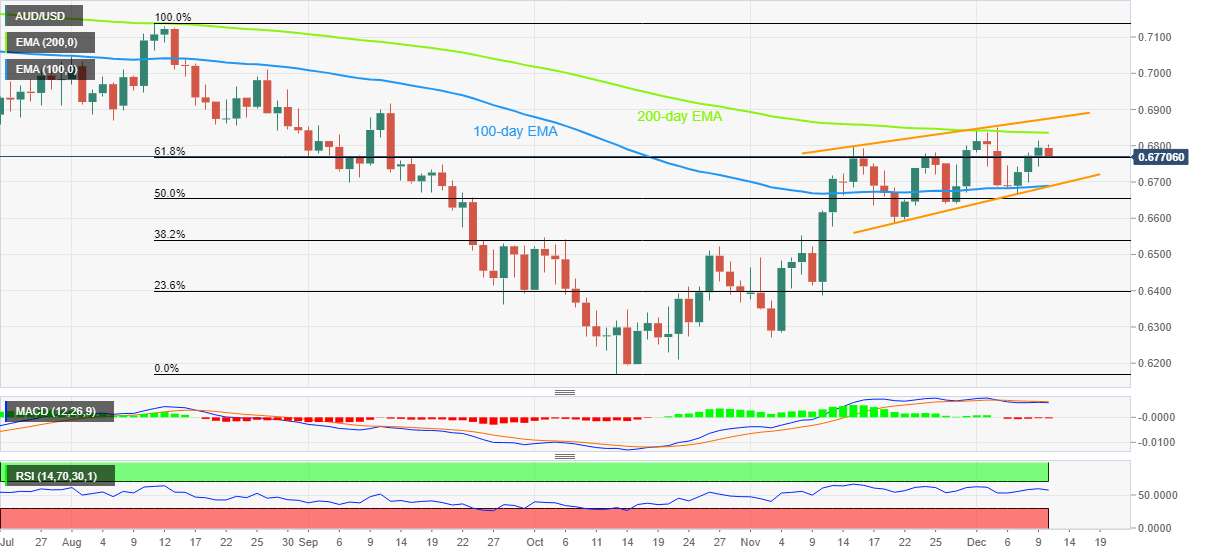
AUD/USD Price Analysis: Revisits 61.8% Fibo. level to snap three-day uptrend below 0.6800


  • AUD/USD takes offers to refresh intraday low, prints the first daily loss in four.
  • 61.8% Fibonacci retracement level will challenge the bears ahead of the key 0.6690 support confluence.
  • Rising wedge teases sellers, 200-day EMA acts as immediate upside hurdle.

AUD/USD begins the key week on the negative side as it takes offers to refresh the intraday low near 0.6770 while snapping a three-day uptrend during early Monday in Asia. In doing so, the Aussie pair pokes the 61.8% Fibonacci retracement level of the pair’s August-October downside.

Even if the key Fibonacci retracement level, also known as the “Golden Ratio”, challenges the AUD/USD bears near 0.6770, the recently bearish MACD signals and the sluggish RSI (14) suggest the quote’s further downside. Also keeping the pair sellers hopeful is the one-month-old rising wedge bearish chart formation on the daily play.

It’s worth noting, however, that a convergence of the 100-day EMA and the stated wedge’s support line, near 0.6690, appears a tough nut to crack for the AUD/USD bears.

Following that, a south run towards the 38.2% Fibonacci retracement level near 0.6540 and then to the 0.6425 theoretical target can’t be ruled out.

Alternatively, the 200-day EMA level surrounding 0.6840 restricts immediate AUD/USD upside ahead of the aforementioned rising wedge’s top, close to 0.6880 by the press time.

In a case where the AUD/USD bulls keep the reins past 0.6880, the late August high near the 0.7000 round figure will be in focus.

AUD/USD: Daily chart

Trend: Further downside expected

Additional important levels

Overview
Today last price 0.677
Today Daily Change -0.0025
Today Daily Change % -0.37%
Today daily open 0.6795
 
Trends
Daily SMA20 0.6724
Daily SMA50 0.6527
Daily SMA100 0.668
Daily SMA200 0.691
 
Levels
Previous Daily High 0.6814
Previous Daily Low 0.6744
Previous Weekly High 0.6851
Previous Weekly Low 0.6669
Previous Monthly High 0.6801
Previous Monthly Low 0.6272
Daily Fibonacci 38.2% 0.6787
Daily Fibonacci 61.8% 0.677
Daily Pivot Point S1 0.6754
Daily Pivot Point S2 0.6714
Daily Pivot Point S3 0.6684
Daily Pivot Point R1 0.6824
Daily Pivot Point R2 0.6854
Daily Pivot Point R3 0.6894


Share: Feed news

Information on these pages contains forward-looking statements that involve risks and uncertainties. Markets and instruments profiled on this page are for informational purposes only and should not in any way come across as a recommendation to buy or sell in these assets. You should do your own thorough research before making any investment decisions. FXStreet does not in any way guarantee that this information is free from mistakes, errors, or material misstatements. It also does not guarantee that this information is of a timely nature. Investing in Open Markets involves a great deal of risk, including the loss of all or a portion of your investment, as well as emotional distress. All risks, losses and costs associated with investing, including total loss of principal, are your responsibility. The views and opinions expressed in this article are those of the authors and do not necessarily reflect the official policy or position of FXStreet nor its advertisers. The author will not be held responsible for information that is found at the end of links posted on this page.

If not otherwise explicitly mentioned in the body of the article, at the time of writing, the author has no position in any stock mentioned in this article and no business relationship with any company mentioned. The author has not received compensation for writing this article, other than from FXStreet.

FXStreet and the author do not provide personalized recommendations. The author makes no representations as to the accuracy, completeness, or suitability of this information. FXStreet and the author will not be liable for any errors, omissions or any losses, injuries or damages arising from this information and its display or use. Errors and omissions excepted.

The author and FXStreet are not registered investment advisors and nothing in this article is intended to be investment advice.

Recommended content


Recommended content

Editors’ Picks

USD/JPY jumps above 156.00 on BoJ's steady policy

USD/JPY jumps above 156.00 on BoJ's steady policy

USD/JPY has come under intense buying pressure, surging past 156.00 after the Bank of Japan kept the key rate unchanged but tweaked its policy statement. The BoJ maintained its fiscal year 2024 and 2025 core inflation forecasts, disappointing the Japanese Yen buyers. 

USD/JPY News

AUD/USD consolidates gains above 0.6500 after Australian PPI data

AUD/USD consolidates gains above 0.6500 after Australian PPI data

AUD/USD is consolidating gains above 0.6500 in Asian trading on Friday. The pair capitalizes on an annual increase in Australian PPI data. Meanwhile, a softer US Dollar and improving market mood also underpin the Aussie ahead of the US PCE inflation data. 

AUD/USD News

Gold price flatlines as traders look to US PCE Price Index for some meaningful impetus

Gold price flatlines as traders look to US PCE Price Index for some meaningful impetus

Gold price lacks any firm intraday direction and is influenced by a combination of diverging forces. The weaker US GDP print and a rise in US inflation benefit the metal amid subdued USD demand. Hawkish Fed expectations cap the upside as traders await the release of the US PCE Price Index.

Gold News

Stripe looks to bring back crypto payments as stablecoin market cap hits all-time high

Stripe looks to bring back crypto payments as stablecoin market cap hits all-time high

Stripe announced on Thursday that it would add support for USDC stablecoin, as the stablecoin market exploded in March, according to reports by Cryptocompare.

Read more

US economy: Slower growth with stronger inflation

US economy: Slower growth with stronger inflation

The US Dollar strengthened, and stocks fell after statistical data from the US. The focus was on the preliminary estimate of GDP for the first quarter. Annualised quarterly growth came in at just 1.6%, down from the 2.5% and 3.4% previously forecast.

Read more

Forex MAJORS

Cryptocurrencies

Signatures