|

AUD/USD Price Analysis: Retreats from monthly resistance, 100-SMA towards 0.6800

  • AUD/USD takes offers to renew intraday low as it pares the biggest daily gains in a month.
  • Receding bullish bias of MACD, RSI pullback adds strength to the fall targeting 50-SMA.
  • 200-SMA adds to the upside filters, bears have a bumpy road before retaking control.

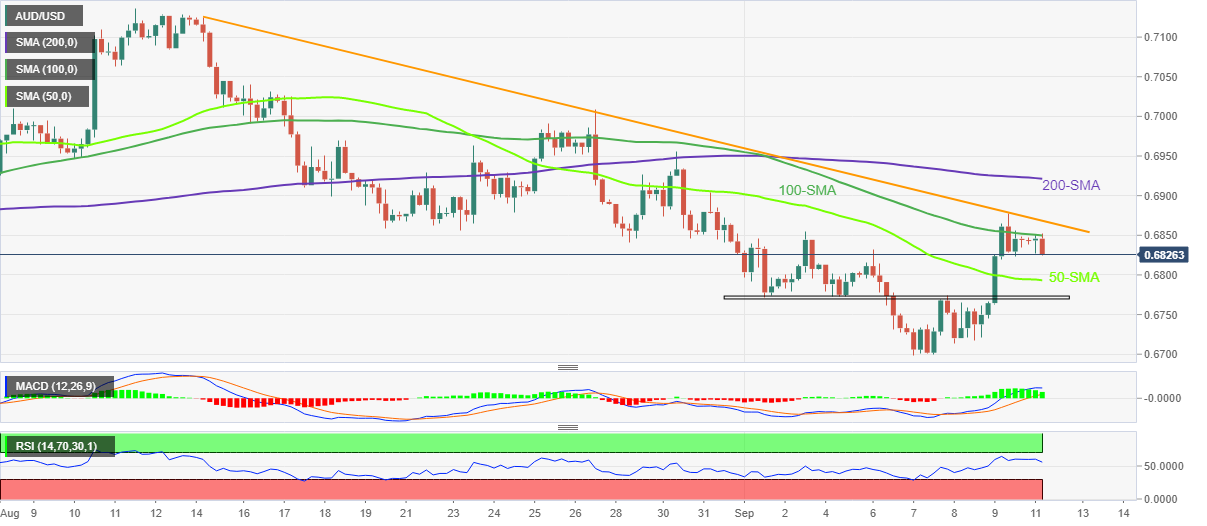
AUD/USD consolidates the biggest daily gains in a month as it refreshes intraday low around 0.6825-30 during Monday’s Asian session. In doing so, the Aussie pair takes a U-turn from the downward sloping resistance line from August 15 as well as the 100-SMA.

Given the receding bullish bias of the MACD and the RSI retreat, the AUD/USD prices are likely to witness further downside.

However, the 0.6800 threshold and the 50-SMA, around 0.6790, could challenge the intraday sellers.

Following that, the monthly horizontal support area, around 0.6770, appears the last defense of the AUD/USD bulls before challenging the yearly low of 0.6700.

Meanwhile, the 100-SMA and the aforementioned resistance line, respectively near 0.6850 and 0.6870, challenge short-term AUD/USD upside ahead of the 200-SMA hurdle surrounding 0.6925.

It’s worth noting that the pair’s run-up beyond 0.6925 enables it to overcome the 0.7000 psychological magnet, which in turn highlights the late August swing high near 0.7010 for the bulls to watch as a probable challenge.

AUD/USD: Four-hour chart

Trend: Limited downside expected

Additional important levels

Overview
Today last price0.6829
Today Daily Change-0.0015
Today Daily Change %-0.22%
Today daily open0.6844
 
Trends
Daily SMA200.6874
Daily SMA500.6896
Daily SMA1000.6969
Daily SMA2000.7116
 
Levels
Previous Daily High0.6877
Previous Daily Low0.6745
Previous Weekly High0.6877
Previous Weekly Low0.6699
Previous Monthly High0.7137
Previous Monthly Low0.6835
Daily Fibonacci 38.2%0.6827
Daily Fibonacci 61.8%0.6795
Daily Pivot Point S10.6766
Daily Pivot Point S20.669
Daily Pivot Point S30.6634
Daily Pivot Point R10.6899
Daily Pivot Point R20.6954
Daily Pivot Point R30.7031

Author

Anil Panchal

Anil Panchal

FXStreet

Anil Panchal has nearly 15 years of experience in tracking financial markets. With a keen interest in macroeconomics, Anil aptly tracks global news/updates and stays well-informed about the global financial moves and their implications.

More from Anil Panchal
Share:

Editor's Picks

EUR/USD seems fragile below 1.1700 as Middle East war boosts energy prices

The EUR/USD pair trades flat at around 1.1680 during the Asian trading session on Tuesday, but broadly seems vulnerable, being close to its five-week low. The major currency pair is under pressure as surging oil prices due to the United States-Israel war with Iran have increased the risks of higher inflation for the Old Continent.

GBP/USD hovers around 1.3400 with bearish pressure intact

GBP/USD edges higher after three days of losses, trading around 1.3400 during the Asian hours on Tuesday. The technical analysis of the daily chart indicates an ongoing bearish bias, as the pair trades within a descending channel pattern.

Gold sticks to gains above $5,350 amid sustained safe-haven demand; firmer USD caps gains

Gold sticks to its positive bias for the third straight day and trades above the $5,350 level heading into the European session on Tuesday. Concerns about a broader regional conflict in the Middle East continue to weigh on investors' sentiment and underpin demand for the traditional safe-haven bullion.

Stellar risks deeper losses as derivatives metrics turn negative

Stellar is trading red below $0.16 at the time of writing on Tuesday, after a slight recovery the previous day. Weakening derivatives data caps the recovery, while an unfavorable technical outlook projects a deeper correction for the XLM token in the upcoming days.

The market is not panicking it is repricing the probability distribution of Oil and time

At the end of the day, markets do not trade morality or geopolitics. They trade transmission channels. And the only channel that truly matters in this maelstrom runs through the price of energy and the time value of money.

Hyperliquid Price Forecast: HYPE rises on commodities demand amid US-Iran war

Hyperliquid (HYPE) steadies above $33 at press time on Tuesday, marking its fourth consecutive day of recovery in a broadly volatile market due to the ongoing US-Israel strikes on Iran.