|

AUD/USD Price Analysis: Recaptures key support-turned-resistance at 0.6575

  • AUD/USD recovers above key 200-day SMA support-turned-resistance, as US Dollar turns south.
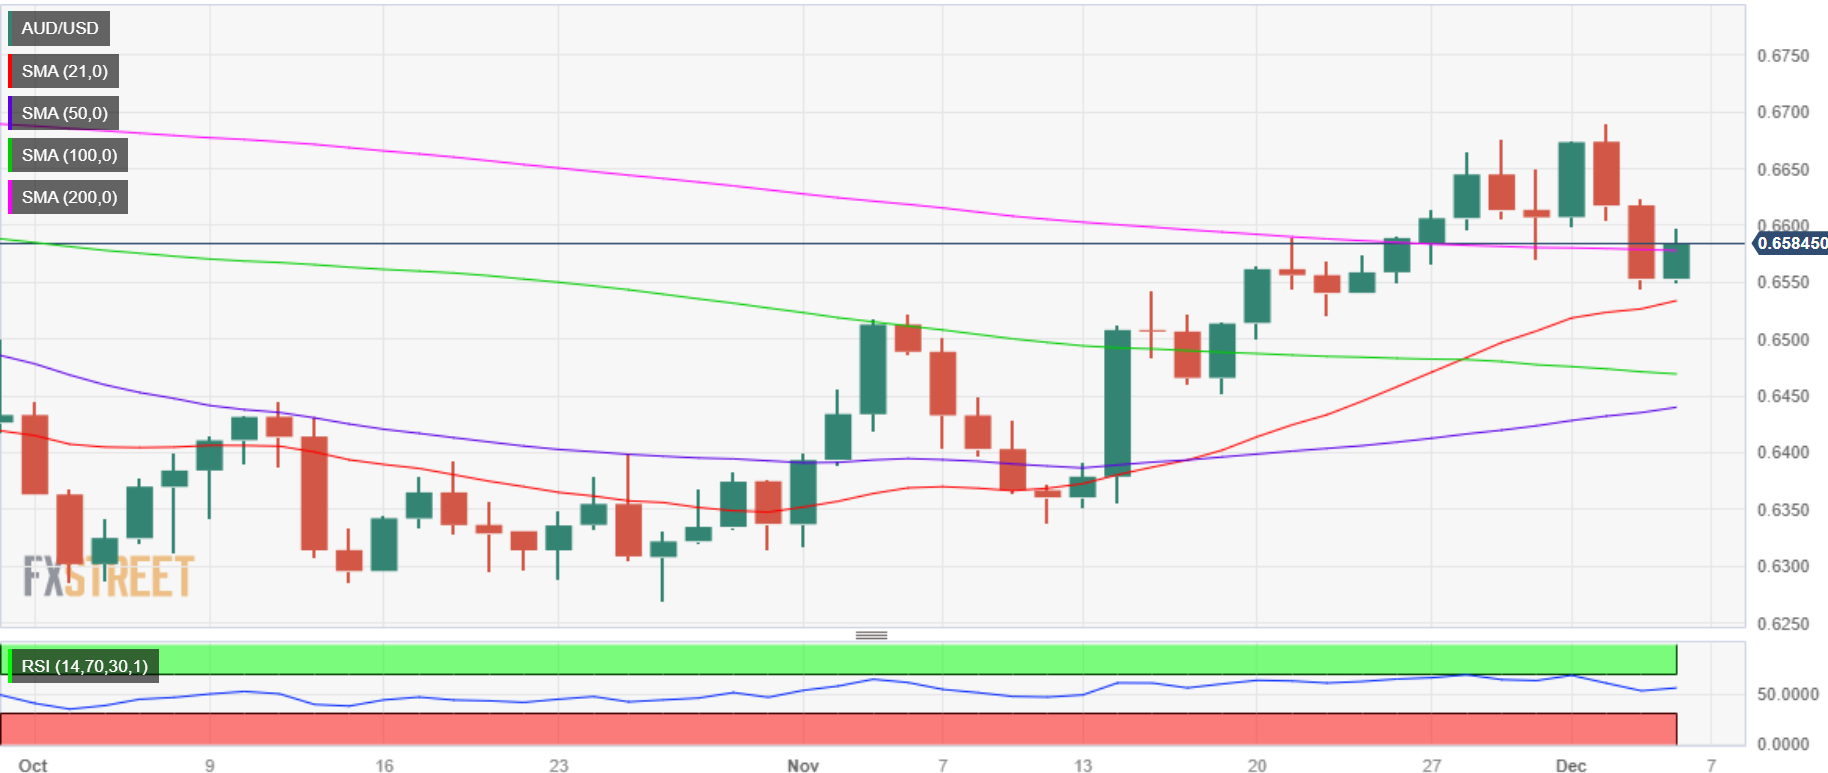
  • Daily RSI is firming up above the midline while the 21-day SMA at 0.6535 offers strong support.
  • If AUD/USD buyers reclaim 97.00, a rally to 98.00 is on the cards.

AUD/USD is on a solid recovery mode above 0.6550 on Wednesday, reversing half the previous day’s sell-off. The pair’s rebound is supported by a retreat in the US Dollar across the board, as traders turn cautious ahead of the key US ADP employment report.

However, Aussie buyers seem to face rejection just shy of the 0.6600 level amid renewed China debt worries. Moody’s Investors Service on Tuesday downgraded its outlook on China’s government credit ratings to negative from stable.

The further upside in the Aussie could remain capped, courtesy of the dovish pause by the Reserve Bank of Australia (RBA) a day ago. The RBA held the interest rate steady at 4.35% in November while maintaining a cautious tone on its interest rate outlook.

AUD/USD technical analysis: Daily Chart

From a short-term technical perspective, the pair has recaptured the 200-day Simple Moving Average (SMA) at 0.6575 on the road to recovery, having settled Tuesday below the latter.

The 14-day Relative Strength Index (RSI) is pointing north while above the midline, justifying the bounce in the Aussie pair.

Buyers need acceptance above the 200-day SMA to initiate a fresh uptrend toward the July 31 high of 0.6740. Ahead of that, the 0.6700 level could challenge the bearish commitments.

 On the downside, strong support is envisioned at the 21-day SMA at 0.6535, below which the 0.6500 mark will be the next cushion. Deeper declines will test the 100-day SMA at 0.6469.

AUD/USD: Additional technical levels

AUD/USD

Overview
Today last price0.6585
Today Daily Change0.0031
Today Daily Change %0.47
Today daily open0.6553
 
Trends
Daily SMA200.6531
Daily SMA500.6435
Daily SMA1000.6471
Daily SMA2000.6579
 
Levels
Previous Daily High0.6624
Previous Daily Low0.6544
Previous Weekly High0.6677
Previous Weekly Low0.6567
Previous Monthly High0.6677
Previous Monthly Low0.6318
Daily Fibonacci 38.2%0.6575
Daily Fibonacci 61.8%0.6594
Daily Pivot Point S10.6524
Daily Pivot Point S20.6494
Daily Pivot Point S30.6444
Daily Pivot Point R10.6603
Daily Pivot Point R20.6654
Daily Pivot Point R30.6683

Author

Dhwani Mehta

Dhwani Mehta

FXStreet

Residing in Mumbai (India), Dhwani is a Senior Analyst and Manager of the Asian session at FXStreet. She has over 10 years of experience in analyzing and covering the global financial markets, with specialization in Forex and commodities markets.

More from Dhwani Mehta
Share:

Markets move fast. We move first.

Orange Juice Newsletter brings you expert driven insights - not headlines. Every day on your inbox.

By subscribing you agree to our Terms and conditions.

Editor's Picks

EUR/USD clings to small gains near 1.1750

Following a short-lasting correction in the early European session, EUR/USD regains its traction and clings to moderate gains at around 1.1750 on Monday. Nevertheless, the pair's volatility remains low, with investors awaiting this weeks key data releases from the US and the ECB policy announcements.

GBP/USD edges higher toward 1.3400 ahead of US data and BoE

GBP/USD reverses its direction and advances toward 1.3400 following a drop to the 1.3350 area earlier in the day. The US Dollar struggles to gather recovery momentum as markets await Tuesday's Nonfarm Payrolls data, while the Pound Sterling holds steady ahead of the BoE policy announcements later in the week.

Gold pulls away from session high, holds above $4,300

Gold loses its bullish momentum and retreats below $4,350 after testing this level earlier on Monday. XAU/USD, however, stays in positive territory as the US Dollar remains on the back foot on growing expectations for a dovish Fed policy outlook next year.

Solana consolidates as spot ETF inflows near $1 billion signal institutional dip-buying

Solana price hovers above $131 at the time of writing on Monday, nearing the upper boundary of a falling wedge pattern, awaiting a decisive breakout. On the institutional side, demand for spot Solana Exchange-Traded Funds remained firm, pushing total assets under management to nearly $1 billion since launch. 

Big week ends with big doubts

The S&P 500 continued to push higher yesterday as the US 2-year yield wavered around the 3.50% mark following a Federal Reserve (Fed) rate cut earlier this week that was ultimately perceived as not that hawkish after all. The cut is especially boosting the non-tech pockets of the market.

Solana Price Forecast: SOL consolidates as spot ETF inflows near $1 billion signal institutional dip-buying

Solana (SOL) price hovers above $131 at the time of writing on Monday, nearing the upper boundary of a falling wedge pattern, awaiting a decisive breakout.