AUD/USD Price Analysis: Pre-open glance on daily chart eyes prospects for a downside continuation
- AUD/USD bulls moved in last week and that could lead to a bullish open.
- Thereafter, there are bearish prospects for the longer term.

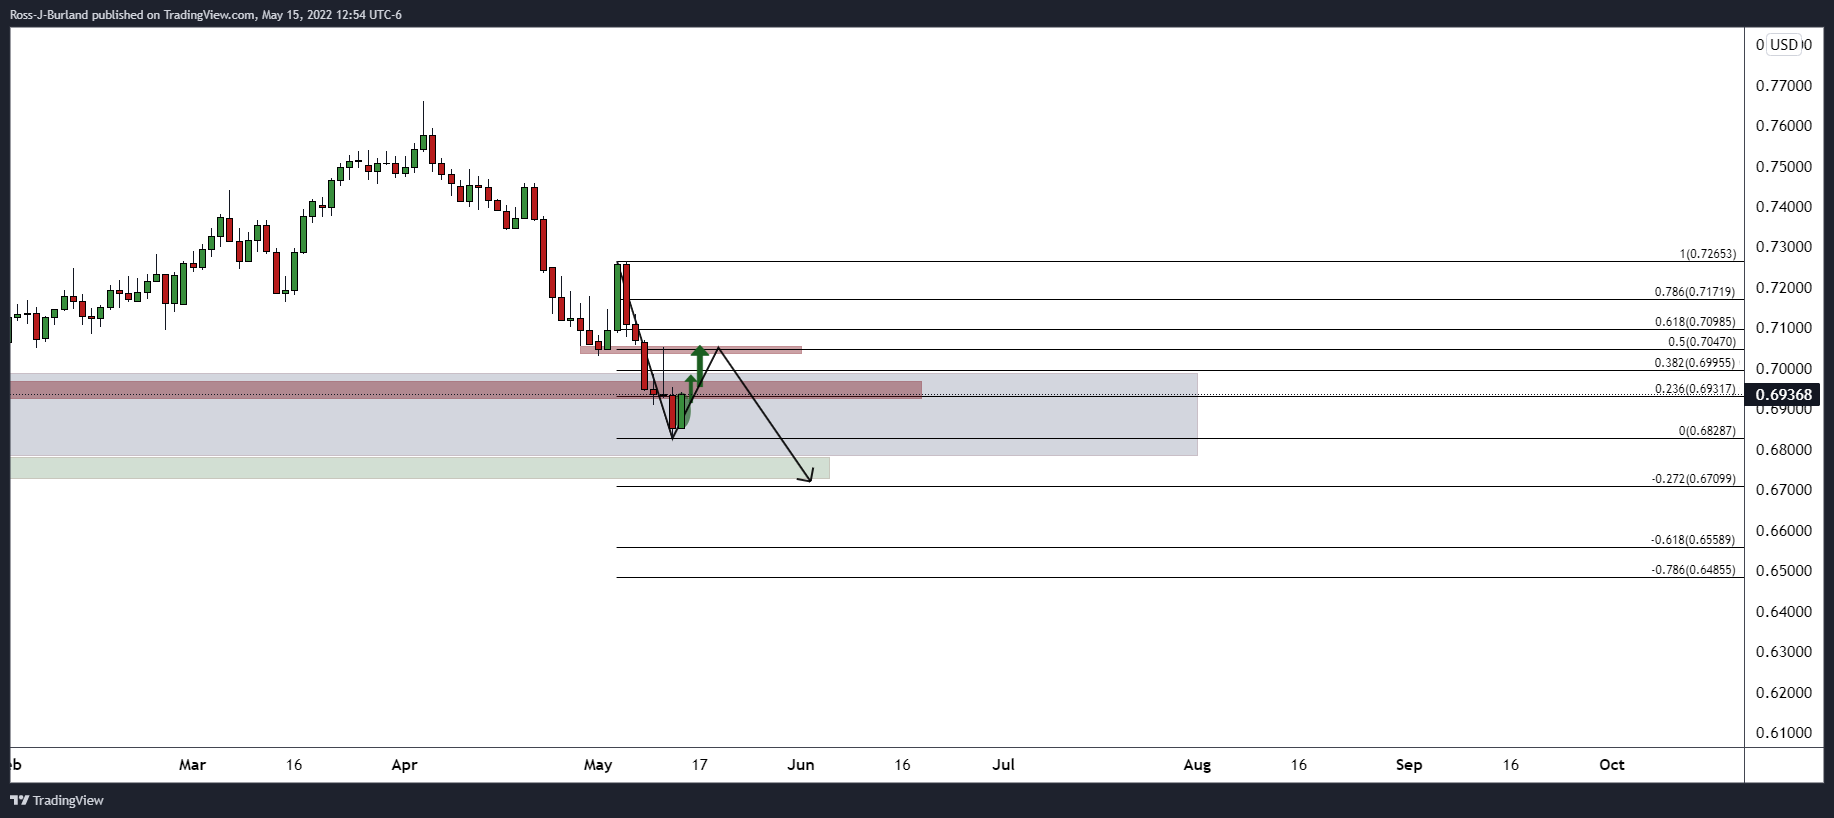
AUD/USD, from a technical perspective, is stacking up for a downside continuation for the week ahead. However, a bullish correction could be on the cards for the opening sessions.
As illustrated below, the close on Friday left a strong bullish candle which shows the bulls have moved in, albeit from within a void in price balance on the longer-term charts which leave the potential for a downside continuation for the foreseeable future.
AUD/USD daily chart
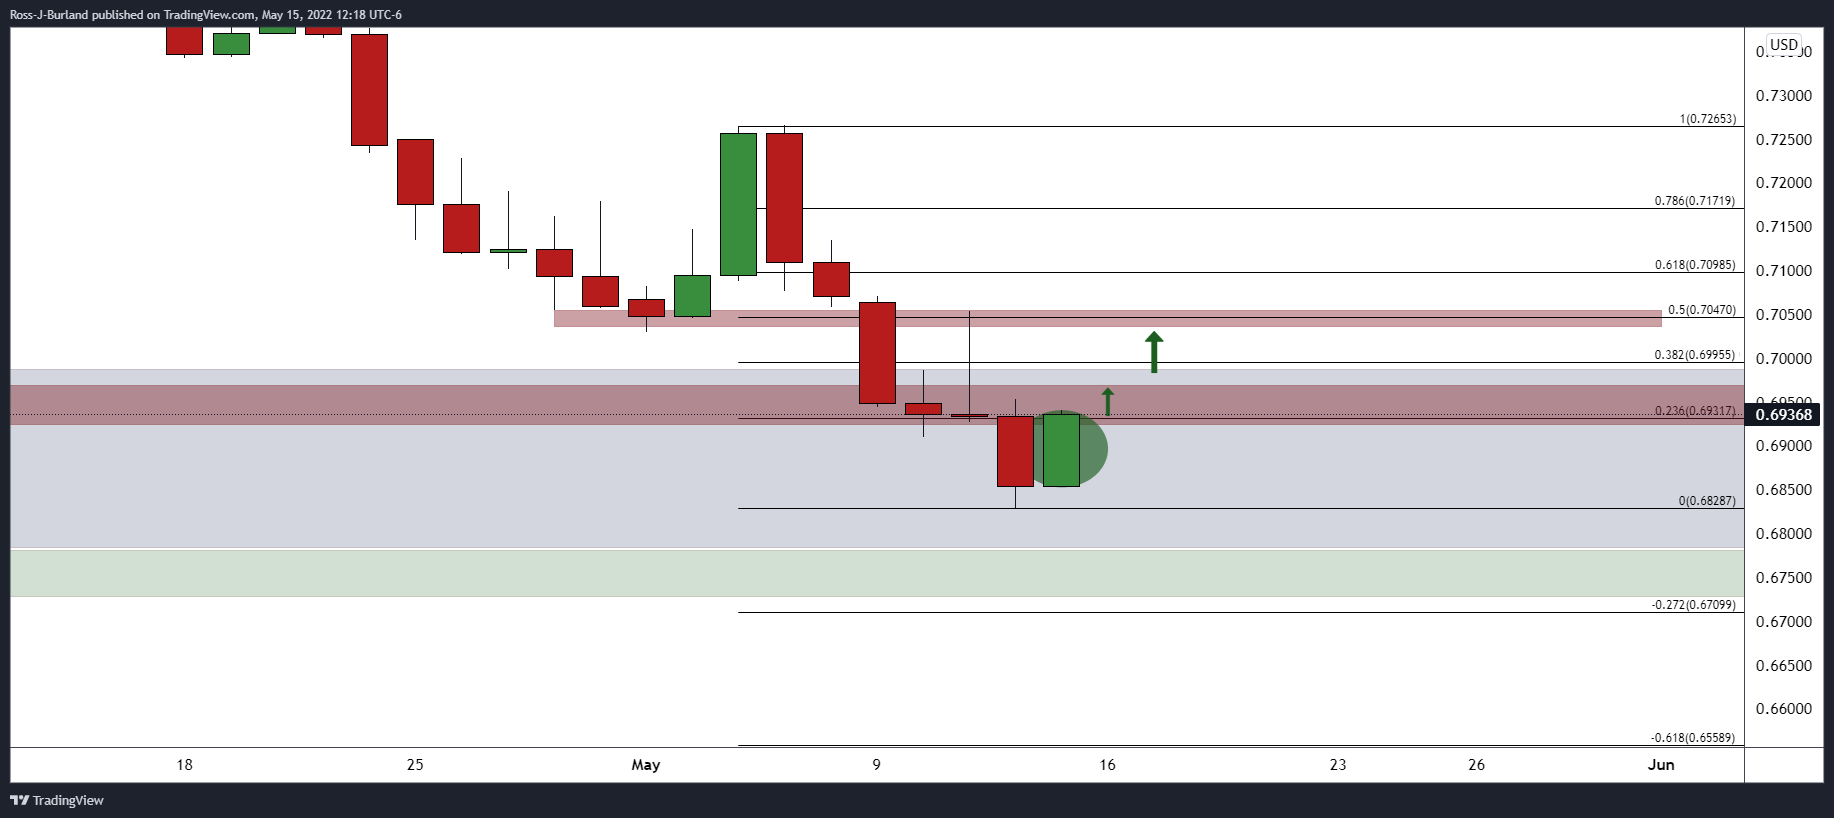
The tweezer bottom and bullish close are fundamental towards a bullish start for the open. There will be prospects of a move to mitigate the price imbalance from the prior highs toward the 50% mean reversion mark in the coming days.
The first objective will be a test of 0.6967 28 Jan lows as per the structure illustrated above. Thereafter, the 0.7050s will be eyed. If bulls commit at either of these levels, it could be all downhill from thereon:
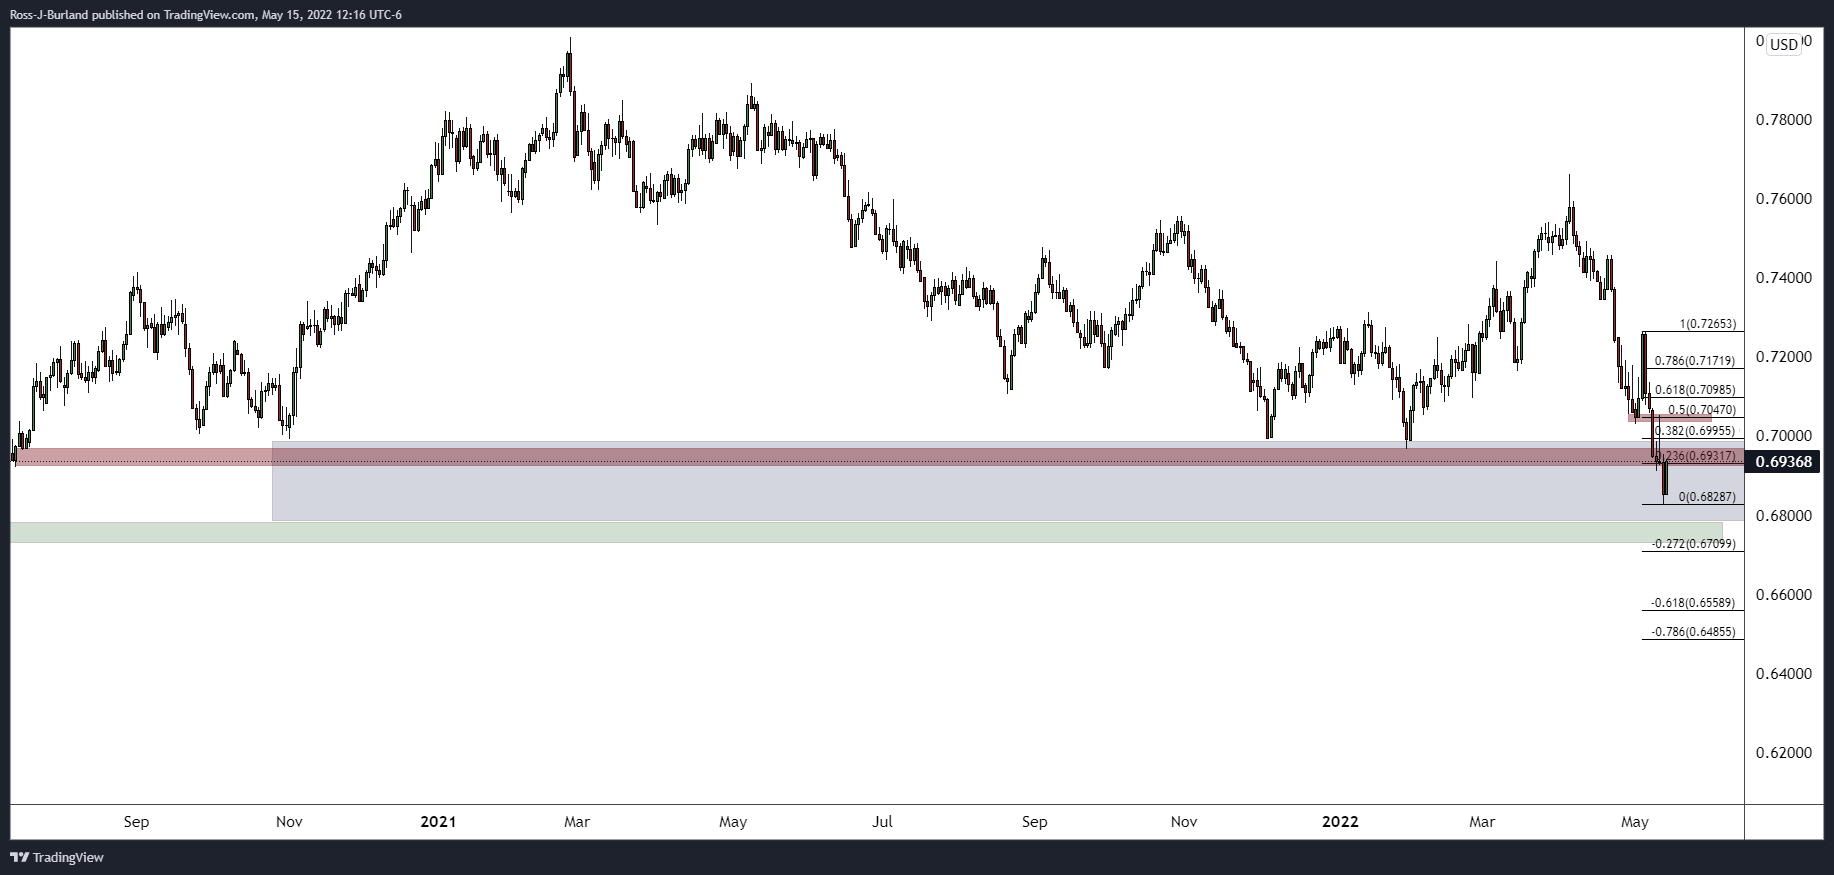
AUD/USD weekly chart
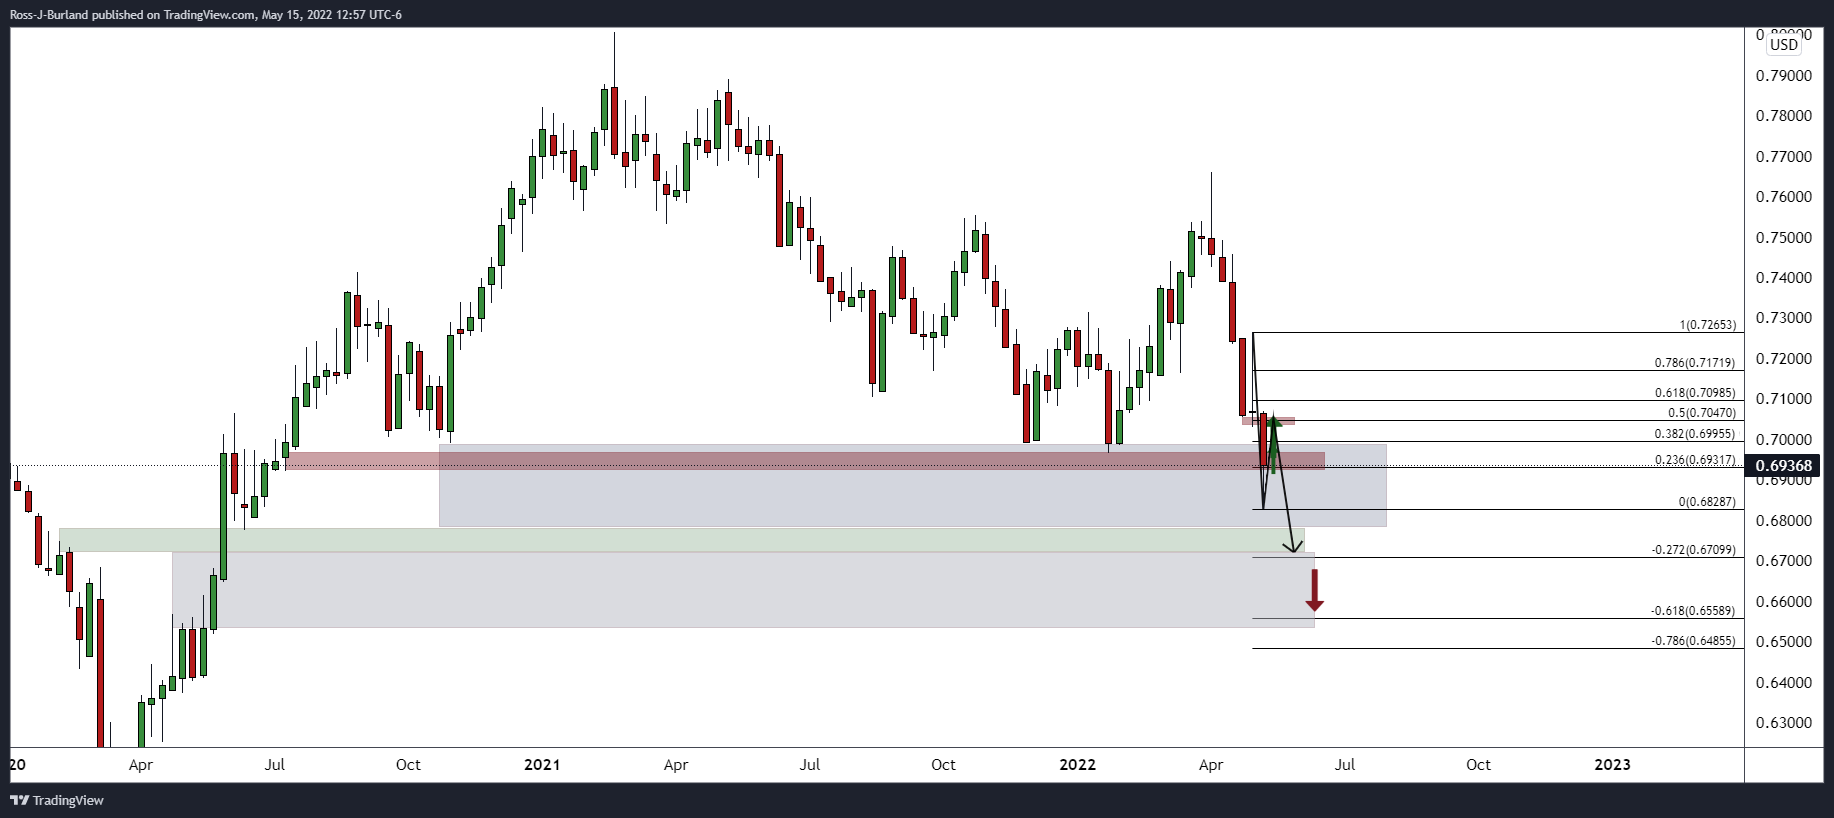
The space below the first presumed support area is a price imbalance all the way to the depths of the 0.6530s.
Author

Ross J Burland
FXStreet
Ross J Burland, born in England, UK, is a sportsman at heart. He played Rugby and Judo for his county, Kent and the South East of England Rugby team.


