|

AUD/USD Price Analysis: Portrays bearish consolidation below 0.6700

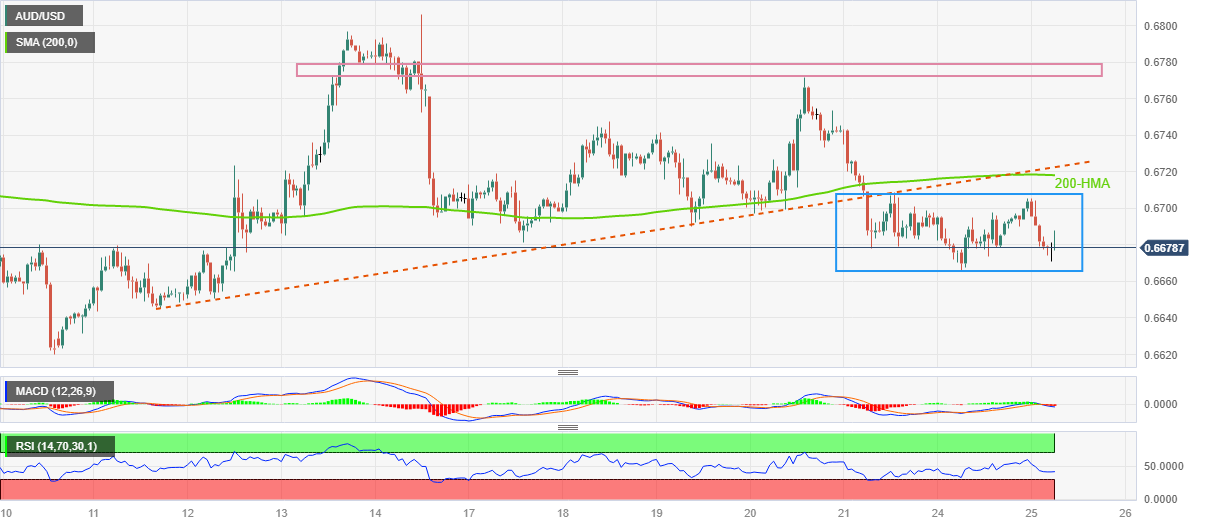
  • AUD/USD remains pressured within 40-pip rectangle, justifies clear break of short-term ascending trend line, 200-HMA.
  • Downbeat oscillators suggest further grinding towards the south.
  • Aussie pair buyers need validation from 0.6780; bears have ample room to cheer.

AUD/USD bears return to the table, following an upbeat start of the week, as the Aussie pair drops to 0.6680 amid early Tuesday morning in Europe.

In doing so, the risk barometer remains within a short-term rectangle formation comprising multiple levels marked since the last Friday amid a steady RSI (14) line, below the median line of late.

However, a clear downside break of a fortnight-old ascending trend line and the 200-Hour Moving Average (HMA) joins the bearish MACD signals to keep Aussie bears hopeful.

That said, the stated trend continuation pattern’s lower line, close to 0.6665 of late, puts a floor under the AUD/USD prices, a break of which could quickly direct the sellers towards the monthly low of 0.6620.

In a case where the AUD/USD price remains bearish past 0.6620, the 0.6600 round figure and the yearly low marked in March around 0.6560 could lure the sellers.

On the flip side, the aforementioned rectangle’s top line, around 0.6710 at the latest, precedes the 200-HMA level of 0.6720 to restrict the short-term recovery of the AUD/USD pair.

Following that, the previous support line stretched from April 11, near 0.6725 can act as the last defense of the AUD/USD bears.

Should the AUD/USD buyers keep the reins past 0.6725, a one-week-old horizontal resistance area between 0.6770 and 0.6780 can challenge the upside momentum.

AUD/USD: Hourly chart

Trend: Further downside expected

Additional important levels

Overview
Today last price0.668
Today Daily Change-0.0016
Today Daily Change %-0.24%
Today daily open0.6696
 
Trends
Daily SMA200.6706
Daily SMA500.6721
Daily SMA1000.6798
Daily SMA2000.6742
 
Levels
Previous Daily High0.6699
Previous Daily Low0.6666
Previous Weekly High0.6772
Previous Weekly Low0.6678
Previous Monthly High0.6784
Previous Monthly Low0.6564
Daily Fibonacci 38.2%0.6686
Daily Fibonacci 61.8%0.6678
Daily Pivot Point S10.6675
Daily Pivot Point S20.6653
Daily Pivot Point S30.6641
Daily Pivot Point R10.6708
Daily Pivot Point R20.672
Daily Pivot Point R30.6742

Author

Anil Panchal

Anil Panchal

FXStreet

Anil Panchal has nearly 15 years of experience in tracking financial markets. With a keen interest in macroeconomics, Anil aptly tracks global news/updates and stays well-informed about the global financial moves and their implications.

More from Anil Panchal
Share:

Editor's Picks

EUR/USD stays weak near 1.1850 after dismal German ZEW data

EUR/USD remains in the red near 1.1850 in the European session on Tuesday. A broad US Dollar bullish consolidation combined with a softer risk tone keep the pair undermined alongside downbeat German ZEW sentiment readings for February. 

GBP/USD holds losees near 1.3600 after weak UK jobs report

GBP/USD is holding moderate losses near the 1.3600 level in Tuesday's European trading. The United Kingdom employment data suggested worsening labor market conditions, bolstering bets for a BoE interest rate cut next month. This narrative keeps the Pound Sterling under bearish pressure. 

Gold pares intraday losses; keeps the red above $4,900 amid receding safe-haven demand

Gold (XAU/USD) attracts some follow-through selling for the second straight day and dives to over a one-week low, around the $4,858 area, heading into the European session on Tuesday. 

Canada CPI expected to show sticky inflation in January, still above BoC’s target

Economists see the headline CPI rising by 2.4% in a year to January, still above the BoC’s target and matching December’s increase. On a monthly basis, prices are expected to rise by 0.1%.

UK jobs market weakens, bolstering rate cut hopes

In the UK, the latest jobs report made for difficult reading. Nonetheless, this represents yet another reminder for the Bank of England that they need to act swiftly given the collapse in inflation expected over the coming months. 

Stellar mixed sentiment caps recovery

Stellar price remains under pressure, trading at $0.170 on Tuesday after failing to close above the key resistance on Sunday. The derivatives metric supports the bearish sentiment, with XLM’s short bets rising among traders and funding rates turning negative.