AUD/USD Price Analysis: Marches towards 0.6450 inside bearish channel


  • AUD/USD extends bounce off 2.5-year low, grinds higher around daily top of late.
  • Rebound from the key support joins price-positive oscillators to keep buyers hopeful.
  • Sellers remain hopes unless the quote stays inside five-week-old bearish channel.

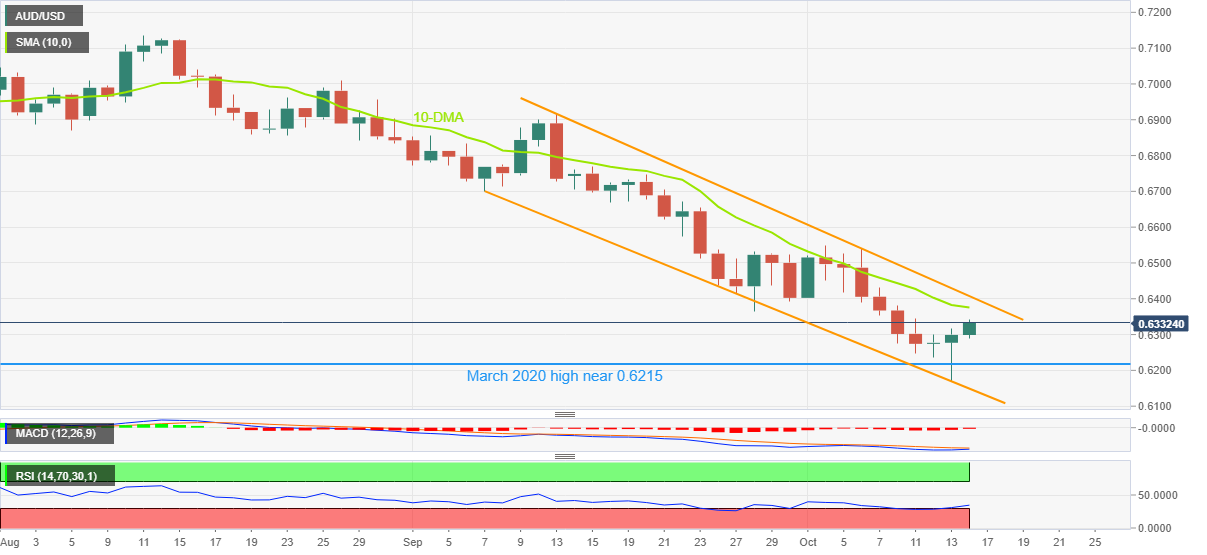
AUD/USD dribbles around the intraday high of 0.6343 while extending the previous day’s rebound from a 30-month low. In doing so, the Aussie pair remains firmer for the second consecutive day while staying inside a bearish chart pattern, namely the descending trend channel established from September 07.

The quote’s rebound from 0.6170 appears a corrective bounce from the aforementioned channel’s support, suggesting further recovery. Also favoring the pair’s upside momentum is the RSI’s gradual uplift from the nearly oversold region and the impending bull cross on the MACD.

With this, the Aussie pair is all-set to challenge the 10-DMA hurdle, around 0.6375. However, the bearish channel’s upper line, close to 0.6410 at the latest, could challenge the AUD/USD buyers afterward.

In a case where the prices successfully cross the 0.6410 hurdle, the odds of witnessing a run-up toward the monthly high of 0.6547 can’t be ruled out.

Alternatively, pullback moves could aim for the 0.6300 threshold before highlighting the March 2020 high near 0.6215.

Following that, the lower line of the channel, around 0.6150 by the press time, will be crucial for the AUD/USD bears to watch.

AUD/USD: Daily chart

Trend: Limited upside expected

Additional important levels

Overview
Today last price 0.6328
Today Daily Change 0.0029
Today Daily Change % 0.46%
Today daily open 0.6299
 
Trends
Daily SMA20 0.6484
Daily SMA50 0.6728
Daily SMA100 0.6844
Daily SMA200 0.7038
 
Levels
Previous Daily High 0.6317
Previous Daily Low 0.617
Previous Weekly High 0.6548
Previous Weekly Low 0.6354
Previous Monthly High 0.6916
Previous Monthly Low 0.6363
Daily Fibonacci 38.2% 0.6261
Daily Fibonacci 61.8% 0.6226
Daily Pivot Point S1 0.6207
Daily Pivot Point S2 0.6116
Daily Pivot Point S3 0.6061
Daily Pivot Point R1 0.6354
Daily Pivot Point R2 0.6408
Daily Pivot Point R3 0.65


Share: Feed news

Information on these pages contains forward-looking statements that involve risks and uncertainties. Markets and instruments profiled on this page are for informational purposes only and should not in any way come across as a recommendation to buy or sell in these assets. You should do your own thorough research before making any investment decisions. FXStreet does not in any way guarantee that this information is free from mistakes, errors, or material misstatements. It also does not guarantee that this information is of a timely nature. Investing in Open Markets involves a great deal of risk, including the loss of all or a portion of your investment, as well as emotional distress. All risks, losses and costs associated with investing, including total loss of principal, are your responsibility. The views and opinions expressed in this article are those of the authors and do not necessarily reflect the official policy or position of FXStreet nor its advertisers. The author will not be held responsible for information that is found at the end of links posted on this page.

If not otherwise explicitly mentioned in the body of the article, at the time of writing, the author has no position in any stock mentioned in this article and no business relationship with any company mentioned. The author has not received compensation for writing this article, other than from FXStreet.

FXStreet and the author do not provide personalized recommendations. The author makes no representations as to the accuracy, completeness, or suitability of this information. FXStreet and the author will not be liable for any errors, omissions or any losses, injuries or damages arising from this information and its display or use. Errors and omissions excepted.

The author and FXStreet are not registered investment advisors and nothing in this article is intended to be investment advice.

Recommended content


Recommended content

Editors’ Picks

AUD/USD favours extra retracements in the short term

AUD/USD favours extra retracements in the short term

AUD/USD kept the negative stance well in place and briefly broke below the key 0.6400 support to clinch a new low for the year on the back of the strong dollar and mixed results from the Chinese docket.

AUD/USD News

EUR/USD now shifts its attention to 1.0500

EUR/USD now shifts its attention to 1.0500

The ongoing upward momentum of the Greenback prompted EUR/USD to lose more ground, hitting new lows for 2024 around 1.0600, driven by the significant divergence in monetary policy between the Fed and the ECB.

EUR/USD News

Gold aiming to re-conquer the $2,400 level

Gold aiming to re-conquer the $2,400 level

Gold stages a correction on Tuesday and fluctuates in negative territory near $2,370 following Monday's upsurge. The benchmark 10-year US Treasury bond yield continues to push higher above 4.6% and makes it difficult for XAU/USD to gain traction.

Gold News

Bitcoin price defends $60K as whales hold onto their BTC despite market dip

Bitcoin price defends $60K as whales hold onto their BTC despite market dip

Bitcoin (BTC) price still has traders and investors at the edge of their seats as it slides further away from its all-time high (ATH) of $73,777. Some call it a shakeout meant to dispel the weak hands, while others see it as a buying opportunity.

Read more

Friday's Silver selloff may have actually been great news for silver bulls!

Friday's Silver selloff may have actually been great news for silver bulls!

Silver endured a significant selloff last Friday. Was this another step forward in the bull market? This may seem counterintuitive, but GoldMoney founder James Turk thinks it was a positive sign for silver bulls.

Read more

Forex MAJORS

Cryptocurrencies

Signatures