|

AUD/USD Price Analysis: Inch far from weekly-high above 0.6700 as risk-on mood strengthens

  • AUD/USD has sensed a stellar buying interest amid the declining USD Index.
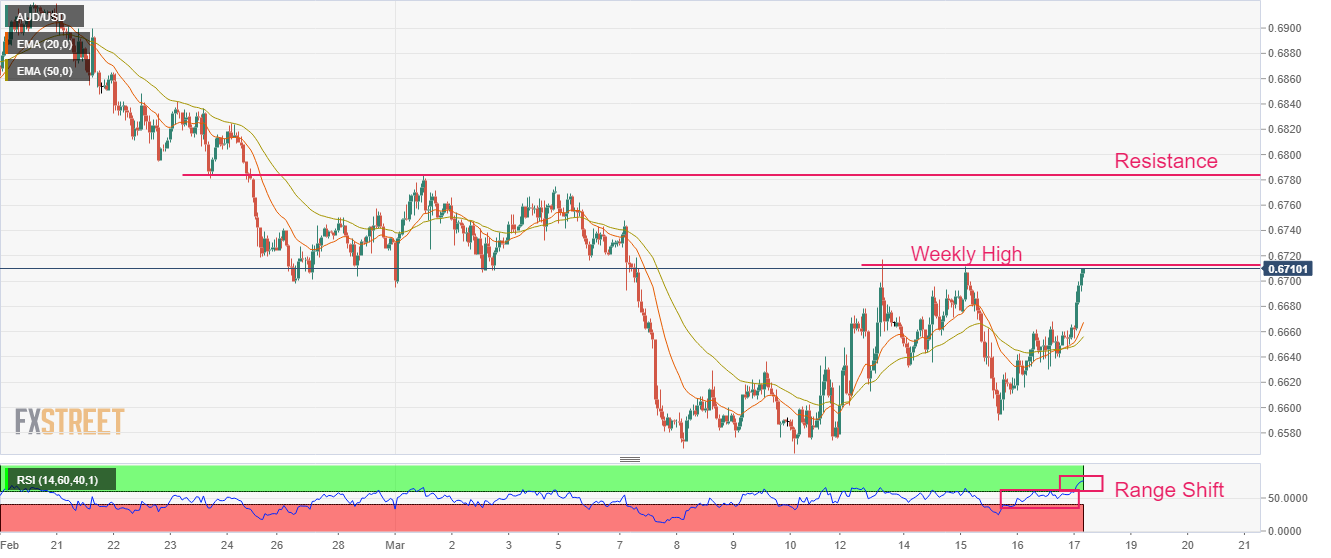
  • A bull cross, delivered by the 20-and 50-period EMAs at 0.6648 indicates more upside ahead.
  • The RS) (14) has shifted into the bullish range, which indicates that the upside momentum has been triggered.

The AUD/USD pair has witnessed sheer buying interest from the market participants and has reached near its weekly high plotted near 0.6720. The Aussie asset has attracted significant bids as investors have lightened their longs in the US Dollar Index (DXY) significantly. The reason behind ignoring the USD Index despite fears of global banking turmoil is the accelerating expectations of a less-hawkish stance on interest rates by the Federal Reserve (Fed) ahead.

S&P500 futures have recovered their nominal losses witnessed in Asian morning and has turned positive now. A follow-up buying in the 500-US stocks basket futures after a prominent Thursday indicates a further strengthening of the risk appetite theme. The USD Index has shifted its auction below 104.20 and is expected to deliver more losses, considering that the risk-aversion theme is fading.

After breaking above the critical resistance of 0.6668, AUD/USD has soared above 0.6700. At the press time, the Aussie asset is hovering near the weekly high. A bull cross, delivered by the 20-and 50-period Exponential Moving Averages (EMAs) at 0.6648 indicates more upside ahead.

Adding to that, the Relative Strength Index (RSI) (14) has shifted into the bullish range of 60.00-80.00, which indicates that the upside momentum has been triggered.

Should the asset breaks above March 13 high at 0.6717, Aussie bulls would drive the asset further toward March 07 high at 0.67478 followed by the horizontal resistance plotted from February 23 low at 0.6781.

On the contrary, a slippage below March 15 low at 0.6564 will drag the asset toward October 4 high at 0.6547 and the round-level support at 0.6500.

AUD/USD hourly chart

AUD/USD

Overview
Today last price0.6708
Today Daily Change0.0052
Today Daily Change %0.78
Today daily open0.6656
 
Trends
Daily SMA200.6721
Daily SMA500.6875
Daily SMA1000.6775
Daily SMA2000.6767
 
Levels
Previous Daily High0.6668
Previous Daily Low0.661
Previous Weekly High0.677
Previous Weekly Low0.6564
Previous Monthly High0.7158
Previous Monthly Low0.6698
Daily Fibonacci 38.2%0.6646
Daily Fibonacci 61.8%0.6633
Daily Pivot Point S10.6621
Daily Pivot Point S20.6587
Daily Pivot Point S30.6563
Daily Pivot Point R10.6679
Daily Pivot Point R20.6703
Daily Pivot Point R30.6737

Author

Sagar Dua

Sagar Dua

FXStreet

Sagar Dua is associated with the financial markets from his college days. Along with pursuing post-graduation in Commerce in 2014, he started his markets training with chart analysis.

More from Sagar Dua
Share:

Editor's Picks

AUD/USD regains mild traction, falters near 0.7150

AUD/USD gathers some steam and manages to flirt with the 0.7150 level on Thursday. However, the pair has retraced some of Wednesday’s significant pullback due to renewed selling pressure on the Greenback and a slight improvement in risk sentiment following hopes of a deal in the Middle East. Wrapping up the Australian docket, the RBA’s Hauser will speak early on Friday.

USD/JPY trades below 160.00 intervention threshold; bullish bias intact

The USD/JPY pair attracts some sellers during the Asian session amid fears that authorities will step in again to prop up the Japanese Yen. Furthermore, the Israel-Lebanon truce prompts some profit-taking around the US Dollar and exerts downward pressure on the currency pair.

Gold puts its 200-day SMA to the test near $4,420

Gold keeps the bullish stance in place in the latter part of Thursday’s session, although a convincing break above the key $4,500 mark per troy ounce still remains elusive. The precious metal’s advance comes amid the resurgence of some selling interest around the Greenback, improving risk sentiment, and declining US Treasury yields across the board.

XRP plummets as ETF outflows, geopolitical tensions reinforce bearish outlook
Ripple (XRP) edges lower, trading around $1.15 at the time of writing on Thursday, its lowest price since February 6. The cross-border money remittance token is extending the sell-off for the fifth consecutive day, reflecting persistent headwinds from ongoing geopolitical tensions and investor uncertainty.
Nonfarm payrolls: Testing the limits of Fed policy patience

The upcoming nonfarm payrolls report for May will provide the final update on the US labor market before Kevin Warsh attends his first policy meeting as the new Fed Chair later this month.

Recession on paper: What really moves the Canadian Loonie now?

Statistics Canada handed the headline writers a gift and the analysts a headache. Real GDP shrank 0.1% on an annualized basis in the first quarter, and with the fourth quarter of 2025 revised down to a 1.0% contraction, that is two negative quarters in a row, the textbook definition of a technical recession and Canada's first since the pandemic.