|

AUD/USD Price Analysis: High forex vol points to continuaiton to weekly support

  • AUD/USD has been correcting the daily bearish impulse on the lower time frames. 
  • The focus is on an H1 38.2% Fibonacci correction near term but for further downside longer term. 
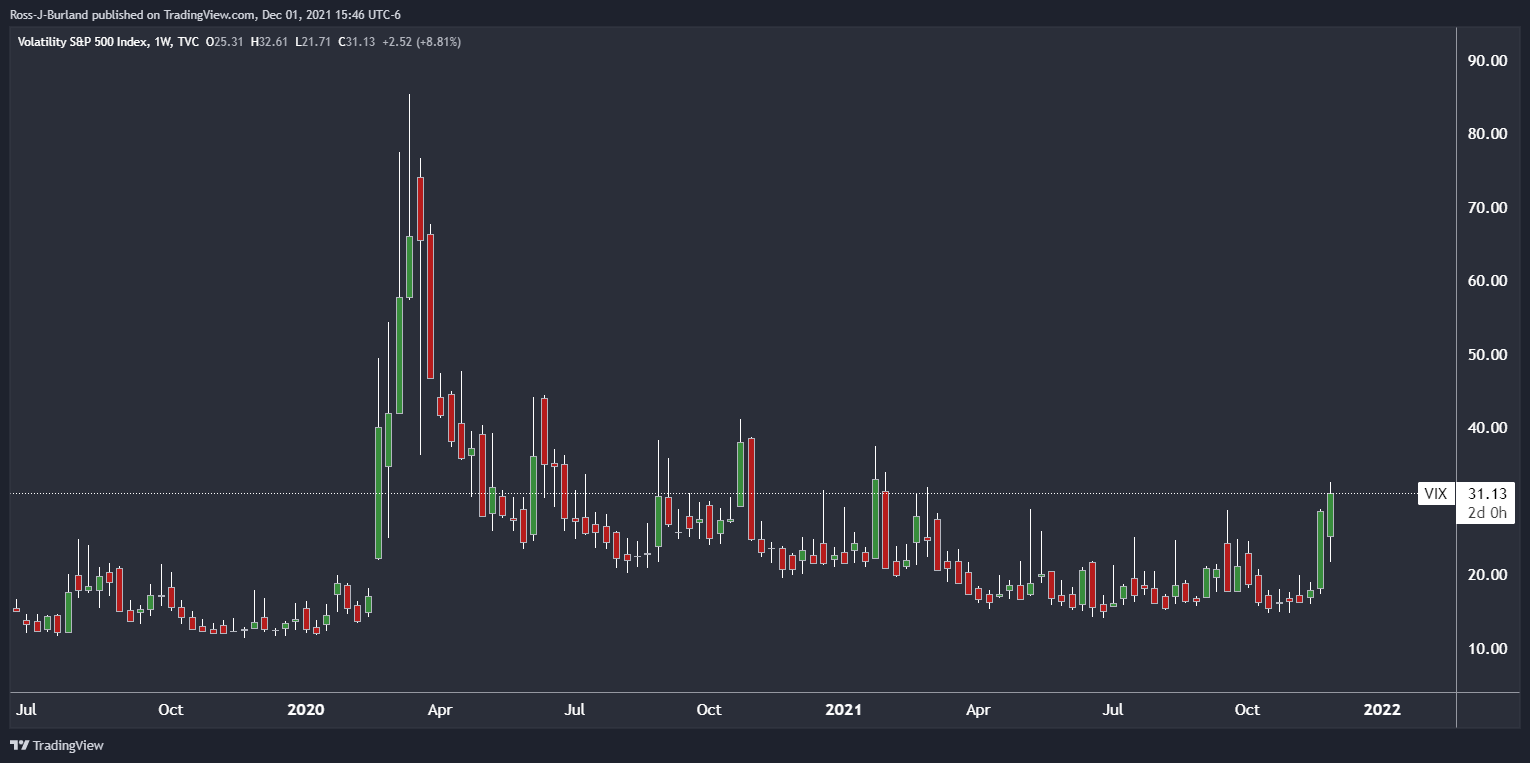
  • Forex volatility is through the roof and the VIX has rallied to fresh highs. 

AUD/USD bulls are stepping in at a familiar level of demand on the hourly time frame. However, the longer-term momentum is with the bears for a deeper continuation towards weekly support. 

AUD/USD weekly chart
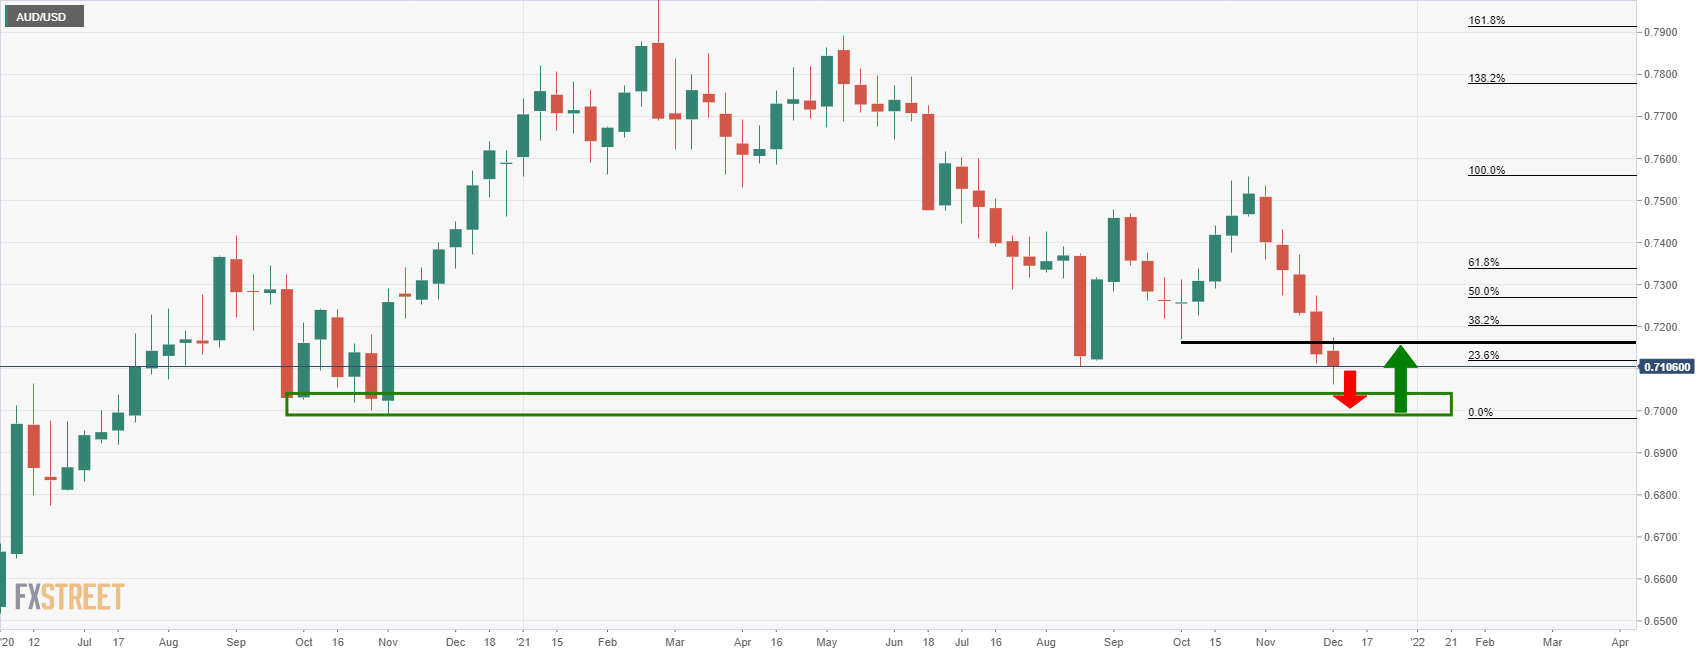
The momentum is to the downside and with the weekly lows near 0.70 the figure eyed as a key target. Meanwhile, the M-formation's neckline should not be ignored near 0.7170. The 38.2% Fibonacci level will have a confluence with 0.72 the figure or there about should the price indeed continue to deteriorate into the weekly lows. This could be a target should the bulls accumulate from the weekly lows in the coming weeks. 

AUD/USD daily chart
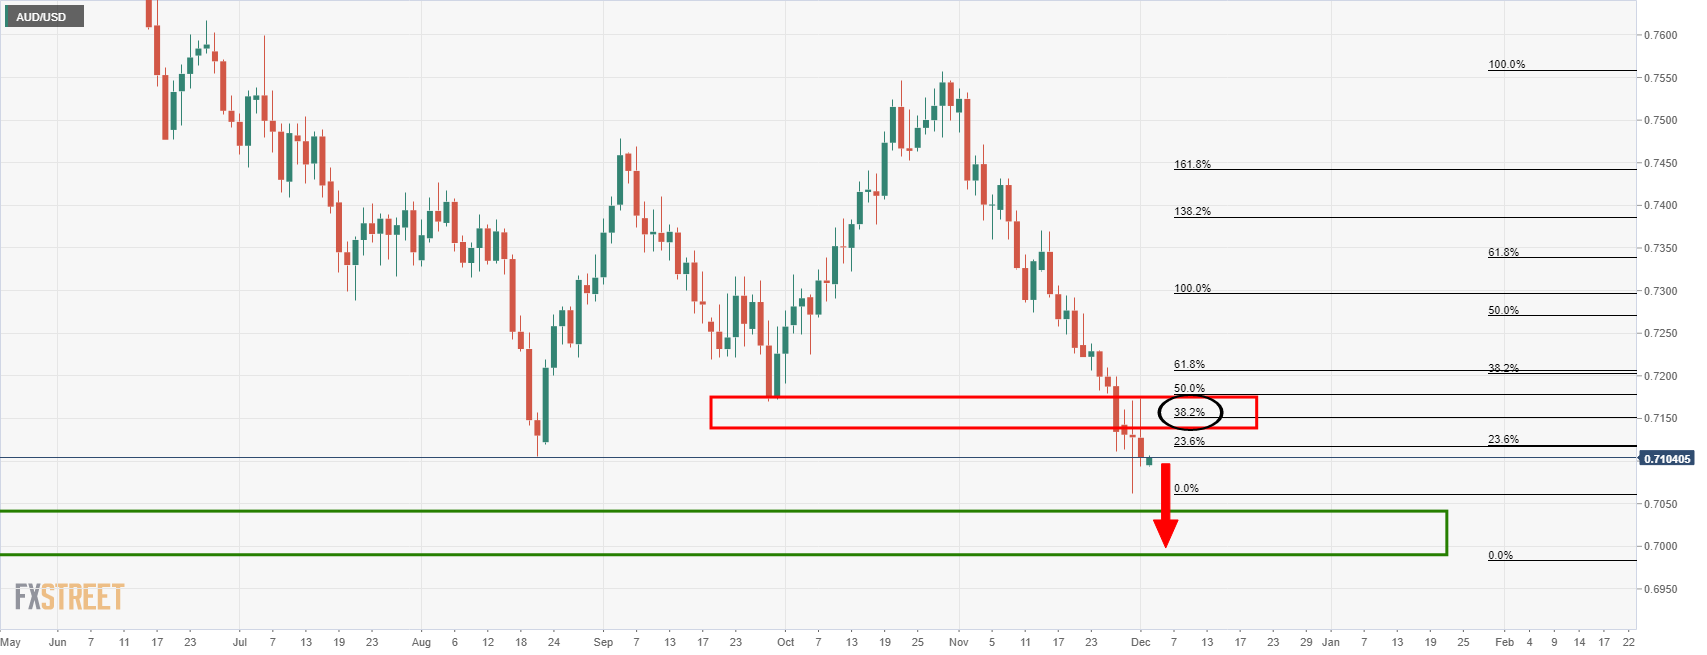
The price has already made a significant correction as per the wicks meeting the 38.2% Fibonacci retracement level . Therefore, there is a high probability of a downside continuation, especially with volatility as high as it is at the moment. The VIX has rallied through 30 and the DBCVIX USD Volatility Index is at the highest it has been since the start of the year.

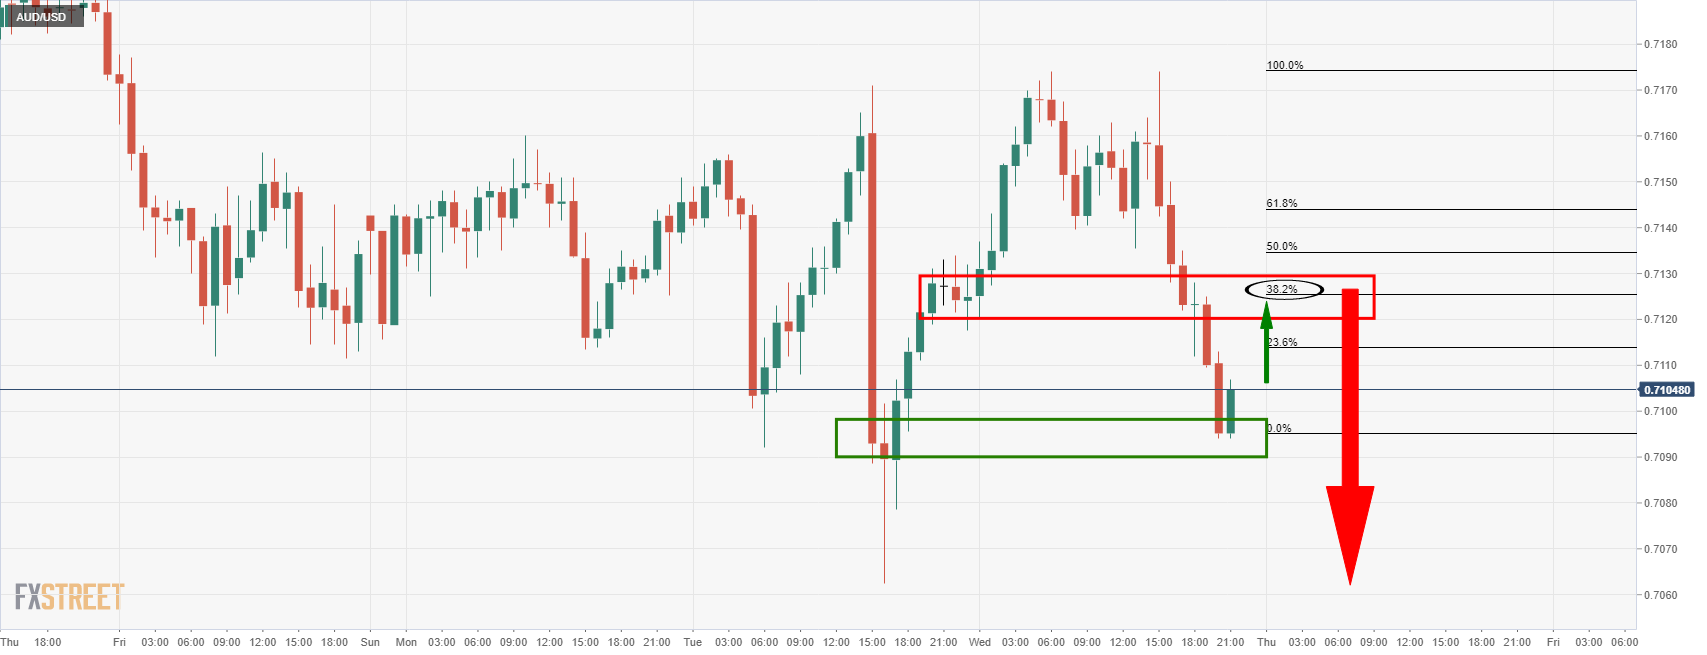
AUD/USD H1 chart

Meanwhile, the bulls are correcting on the lower time frames which bring in the 38.2% Fibonacci into scope for the meantime. 
Author

Ross J Burland

Ross J Burland, born in England, UK, is a sportsman at heart. He played Rugby and Judo for his county, Kent and the South East of England Rugby team.


More from Ross J Burland
Share:

Editor's Picks

GBP/USD breaches below 1.3500, two-day lows

GBP/USD faces renewed selling pressure, eroding the earlier advance and slipping back to the sub-1.3500 region on Wednesday. Cable’s loss of upside momentum follows the resurgence of the demand for the Greenback amid steady geopolitical tensions. Looking ahead, the British Pound is expected to remain under scrutiny in light of the release of UK GDP data on Thursday.

EUR/USD deflates to weekly troughs near 1.1520

EUR/USD accelerates its daily correction, coming close to the 1.1520 region, or weekly lows, in the latter part of Wednesday’s session. The pair’s drop comes amid the US Dollar’s firm rebound, as investors seem to have fully digested the latest US inflation data.

Gold challenges $4,400 amid USD bounce

Gold now gives away part of its earlier advance to the vicinity of the $4,450 mark per troy ounce and approaches the $4,400 hurdle on Wednesday. The yellow metal’s partial loss of momentum comes as the US Dollar manages to regain balance in the wake of the CPI-led decline.

Ripple lags recovery as exchange reserves expand

Ripple is trading within a broadly constrained technical structure, with support at $1.00 and key moving averages limiting its recovery potential. In August, the remittance token declined by approximately 6.5%, extending its total pullback to around 14% from July's $1.18 peak.

911 million shares freed: Why SpaceX rallied into its own supply

The most heavily trailed supply event of the year landed on August 6, and the SpaceX (SPCX) stock went up. Roughly 911.5 million shares held by insiders and early backers became eligible to trade, around 43% more than the entire float sold at the listing.

Why is Crude Oil priced for a reopening the ships haven't made?
Fourteen vessels crossed the Strait of Hormuz on Tuesday. Before the war, the count ran near 120 a day. In the sessions since the waterway was publicly declared open, Brent has drifted back to $87 and West Texas Intermediate (WTI) to $81, both a little lower again on Wednesday, with daily momentum on each unwound from the top of its range in late July to the low twenties now.