|

AUD/USD Price Analysis: Death cross on 4H chart points to more losses

  • AUD/USD extends sell-off after rejection above 0.7700.
  • DXY rebounds, as Treasury yields stabilize while China CPI beats estimates.
  • The 4H chart shows death cross, RSI remains bearish.

AUD/USD drops towards 0.7650, as the bulls failed to resist above the 0.7700 level earlier in the Asian session.

The downside in the aussie could be attributed to the impressive bounce staged by the US dollar across its major peers, as the Treasury yields look to stabilize following a steep correction from 13-month tops a day before.

The price action around the yields and US dollar continues to remain the main market driver, as markets look forward to the US CPI, bond auction and stimulus announcements. The aussie bulls ignored the upbeat Chinese inflation figures amid risk-off market mood.

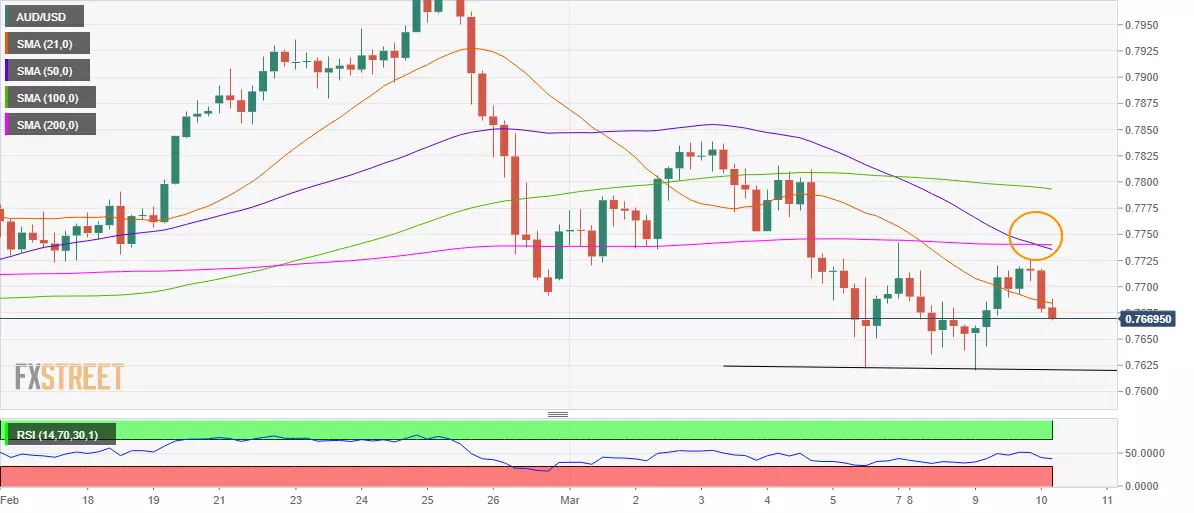
Looking at the spot technically, the bears look to extend their control amid a death cross confirmed on the four-hour chart after the 50-simple moving average (SMA) pierced through the horizontal 200-SMA from above.

The relative strength index (RSI) trends below the midline, allowing room for more declines. Therefore, a drop towards the horizontal trendline support at 0.7620 is likely on the cards, below which the 0.7600 level could be put to test.

On the flip side, the bearish 21-SMA at 0.7684 offers immediate resistance to the major.

All in all, the path of least resistance appears to the downside.

AUD/USD: Four-hour chart

.

AUD/USD: Additional levels

AUD/USD

Overview
Today last price0.7671
Today Daily Change-0.0046
Today Daily Change %-0.60
Today daily open0.7718
 
Trends
Daily SMA200.7784
Daily SMA500.7737
Daily SMA1000.7544
Daily SMA2000.7323
 
Levels
Previous Daily High0.7726
Previous Daily Low0.762
Previous Weekly High0.7838
Previous Weekly Low0.7622
Previous Monthly High0.8008
Previous Monthly Low0.7562
Daily Fibonacci 38.2%0.7686
Daily Fibonacci 61.8%0.7661
Daily Pivot Point S10.765
Daily Pivot Point S20.7583
Daily Pivot Point S30.7545
Daily Pivot Point R10.7756
Daily Pivot Point R20.7794
Daily Pivot Point R30.7861

Author

Dhwani Mehta

Dhwani Mehta

FXStreet

Residing in Mumbai (India), Dhwani is a Senior Analyst and Manager of the Asian session at FXStreet. She has over 10 years of experience in analyzing and covering the global financial markets, with specialization in Forex and commodities markets.

More from Dhwani Mehta
Share:

Editor's Picks

AUD/USD eyes 0.7150 barrier nine-day EMA

AUD/USD inches higher after registering modest losses in the previous day, trading around 0.7130 during the Asian hours. The technical analysis of the daily chart indicates that the pair is moving sideways within the rectangle pattern, suggesting a consolidation as neither the bulls nor the bears have enough momentum to take control of the market.

USD/JPY trades below 160.00 intervention threshold; bullish bias intact

The USD/JPY pair attracts some sellers during the Asian session amid fears that authorities will step in again to prop up the Japanese Yen. Furthermore, the Israel-Lebanon truce prompts some profit-taking around the US Dollar and exerts downward pressure on the currency pair.

Gold defends 200-day SMA at $4,425, but for how long?

Gold is attempting a tepid recovery toward $4,500 early Thursday, as renewed optimism in the Mideast geopolitical front calms market nerves. This cautious optimism across Asian markets weighs on Oil prices, and diminishes the US Dollar’s safe-haven appeal, helping Gold stage a decent comeback from the weekly low of $4,424.


Hyperliquid: ETF demand, capital rotation fuel HYPE rally as Bitcoin melts

Hyperliquid price sustains an upward trend near its all-time high of $75.76 on Thursday after posting 80% gains in May, while Bitcoin (BTC) retraces below $65,000, triggering a market-wide panic.

Kevin Warsh takes the Fed helm: What it means for the US Dollar
The Federal Reserve moves away from the highly predictable "forward guidance" model of the Jerome Powell era to a new “Kevin Warsh environment”, characterized by less communication, more policy surprises, and an increased focus on the Fed's complex balance sheet.
Recession on paper: What really moves the Canadian Loonie now?

Statistics Canada handed the headline writers a gift and the analysts a headache. Real GDP shrank 0.1% on an annualized basis in the first quarter, and with the fourth quarter of 2025 revised down to a 1.0% contraction, that is two negative quarters in a row, the textbook definition of a technical recession and Canada's first since the pandemic.