AUD/USD Price Analysis: Daily closing below 0.6690 appears necessary for bears


  • AUD/USD pokes short-term key support confluence as it braces for the biggest daily loss in a week.
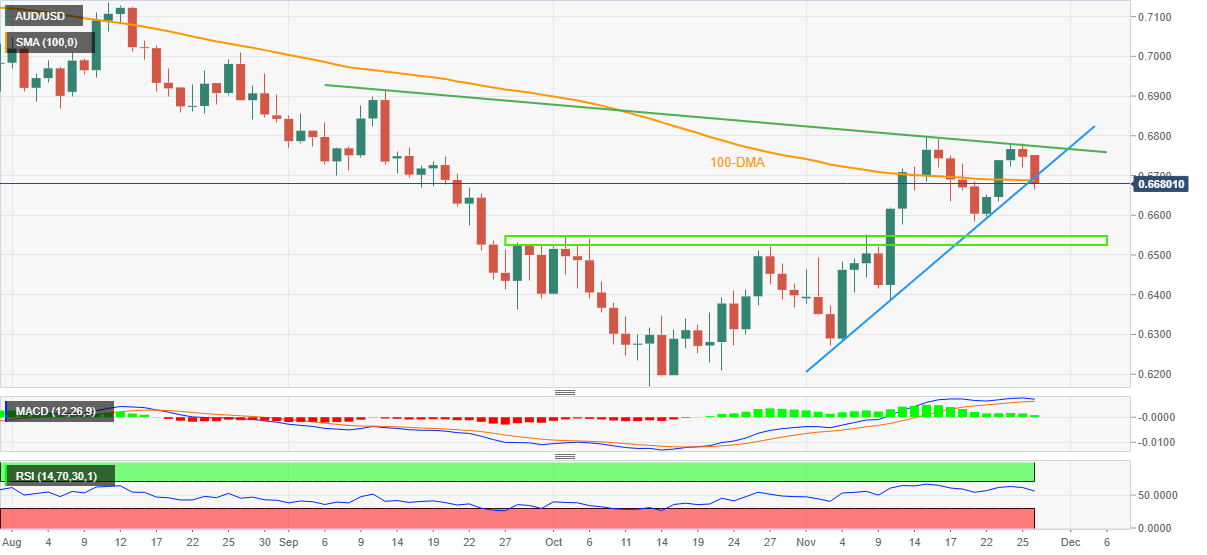
  • Convergence of 100-DMA, three-week-old ascending trend line probes sellers.
  • MACD, RSI conditions tease sellers to aim for a two-month-long horizontal support zone.

AUD/USD bears jostle with short-term key support surrounding 0.6690 as bears try to retake control during early Monday morning in Europe. In doing so, the Aussie pair justifies the market’s risk-off mood as it prepares for the biggest daily fall in a week.

That said, a joint of the 100-Day Moving Average (DMA) and an upward-sloping trend line from November 04, close to 0.6690, appears a tough nut to crack for the AUD/USD pair bears.

It’s worth noting that the impending bear cross on the MACD and the RSI (14) retreat keeps sellers hopeful of breaking the 0.6690 support.

Following that, a south-run towards a broad support region between 0.6550 and 0.6525, comprising multiple levels marked since late September, will gain the market’s attention.

In a case where AUD/USD remains weak past 0.6525, the odds of witnessing a south-run toward the yearly low of 0.6170 can’t be ruled out.

Alternatively, a descending trend line from September 13, close to 0.6775 by the press time, holds the key to AUD/USD buyer’s conviction.

Should the Aussie pair remains firmer past 0.6775, it can quickly refresh the monthly high, currently around 0.6800, by targeting September’s top surrounding 0.6915.

AUD/USD: Daily chart

Trend: Further weakness expected

Additional important levels

Overview
Today last price 0.6682
Today Daily Change -0.0065
Today Daily Change % -0.96%
Today daily open 0.6747
 
Trends
Daily SMA20 0.6585
Daily SMA50 0.6489
Daily SMA100 0.6689
Daily SMA200 0.6936
 
Levels
Previous Daily High 0.6781
Previous Daily Low 0.672
Previous Weekly High 0.6781
Previous Weekly Low 0.6585
Previous Monthly High 0.6548
Previous Monthly Low 0.617
Daily Fibonacci 38.2% 0.6744
Daily Fibonacci 61.8% 0.6758
Daily Pivot Point S1 0.6718
Daily Pivot Point S2 0.6689
Daily Pivot Point S3 0.6658
Daily Pivot Point R1 0.6779
Daily Pivot Point R2 0.681
Daily Pivot Point R3 0.6839


Share: Feed news

Information on these pages contains forward-looking statements that involve risks and uncertainties. Markets and instruments profiled on this page are for informational purposes only and should not in any way come across as a recommendation to buy or sell in these assets. You should do your own thorough research before making any investment decisions. FXStreet does not in any way guarantee that this information is free from mistakes, errors, or material misstatements. It also does not guarantee that this information is of a timely nature. Investing in Open Markets involves a great deal of risk, including the loss of all or a portion of your investment, as well as emotional distress. All risks, losses and costs associated with investing, including total loss of principal, are your responsibility. The views and opinions expressed in this article are those of the authors and do not necessarily reflect the official policy or position of FXStreet nor its advertisers. The author will not be held responsible for information that is found at the end of links posted on this page.

If not otherwise explicitly mentioned in the body of the article, at the time of writing, the author has no position in any stock mentioned in this article and no business relationship with any company mentioned. The author has not received compensation for writing this article, other than from FXStreet.

FXStreet and the author do not provide personalized recommendations. The author makes no representations as to the accuracy, completeness, or suitability of this information. FXStreet and the author will not be liable for any errors, omissions or any losses, injuries or damages arising from this information and its display or use. Errors and omissions excepted.

The author and FXStreet are not registered investment advisors and nothing in this article is intended to be investment advice.

Recommended content


Recommended content

Editors’ Picks

EUR/USD clings to daily gains above 1.0650

EUR/USD clings to daily gains above 1.0650

EUR/USD gained traction and turned positive on the day above 1.0650. The improvement seen in risk mood following the earlier flight to safety weighs on the US Dollar ahead of the weekend and helps the pair push higher.

EUR/USD News

GBP/USD recovers toward 1.2450 after UK Retail Sales data

GBP/USD recovers toward 1.2450 after UK Retail Sales data

GBP/USD reversed its direction and advanced to the 1.2450 area after touching a fresh multi-month low below 1.2400 in the Asian session. The positive shift seen in risk mood on easing fears over a deepening Iran-Israel conflict supports the pair.

GBP/USD News

Gold holds steady at around $2,380 following earlier spike

Gold holds steady at around $2,380 following earlier spike

Gold stabilized near $2,380 after spiking above $2,400 with the immediate reaction to reports of Israel striking Iran. Meanwhile, the pullback seen in the US Treasury bond yields helps XAU/USD hold its ground.

Gold News

Bitcoin Weekly Forecast: BTC post-halving rally could be partially priced in Premium

Bitcoin Weekly Forecast: BTC post-halving rally could be partially priced in

Bitcoin price shows no signs of directional bias while it holds above  $60,000. The fourth BTC halving is partially priced in, according to Deutsche Bank’s research. 

Read more

Week ahead – US GDP and BoJ decision on top of next week’s agenda

Week ahead – US GDP and BoJ decision on top of next week’s agenda

US GDP, core PCE and PMIs the next tests for the Dollar. Investors await BoJ for guidance about next rate hike. EU and UK PMIs, as well as Australian CPIs also on tap.

Read more

Forex MAJORS

Cryptocurrencies

Signatures