|

AUD/USD Price Analysis: Consolidation likely ahead as 200-EMA turns sideways

  • Aussie bulls are facing barricades around 50% Fibo retracement at 0.6983.
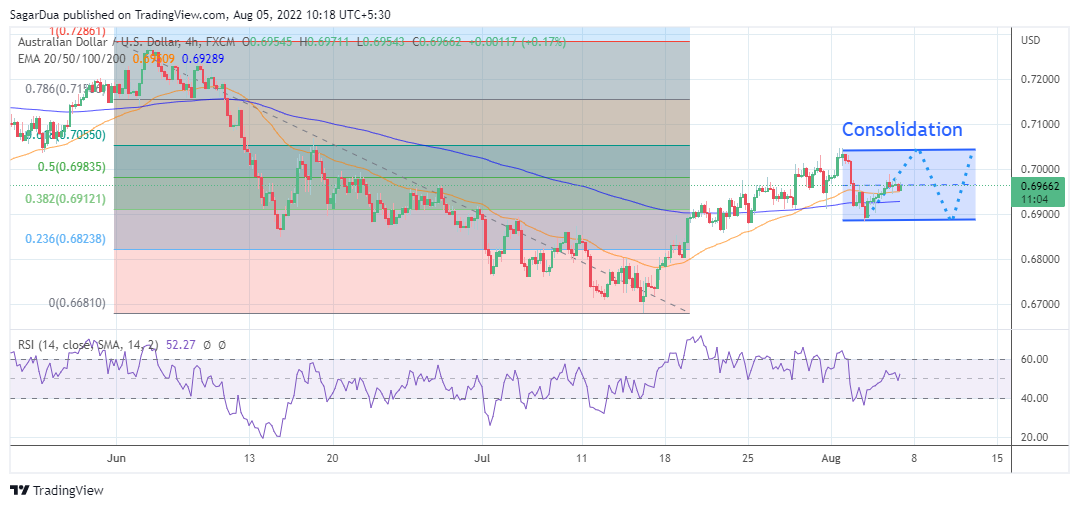
  • The asset is expected to remain sideways in the 0.6890-0.7045 range.
  • The 200-EMA has turned flat while the 50-EMA is overlapping with the asset prices.

The AUD/USD pair is displaying back and forth moves in a narrow range of 0.6945-0.6976 in the Asian session. The asset has turned sideways after a responsive buying action from a cushion below 0.6900. Usually, a responsive buying action indicates the initiation of significant longs by the market participants as they find the asset price a value bet.

On a four-hour scale, the aussie bulls are facing barricades around the 50% Fibonacci retracement (which is placed from June high at 0.7283 to July 14 low at 0.6707) at 0.6983. This has pushed the asset into a charted territory. The asset will consolidate in a 0.6890-0.7045 range ahead.

The 200-period Exponential Moving Average (EMA) at 0.6930. Also, the 50-EMA at 0.6952 is overlapping with the asset prices, which signals a consolidation ahead.

Adding to that, the Relative Strength Index (RSI) (14) has shifted into the 40.00-60.00 range, which indicates that the asset is awaiting a potential trigger for a meaningful move.

A decisive move above the six-week high at 0.7047 will send the major towards the round-level resistance of 0.7100, followed by May 31 high at 0.7204.

Alternatively, a downside break of the above-mentioned consolidation, which is in a 0.6890-0.7045 range will drag the asset towards a 23.6% Fibo retracement at 0.6823. A slippage below 23.6% Fibo retracement will trigger the downside risk to July 5 low at 0.6761.

AUD/USD four-hour chart

AUD/USD

Overview
Today last price0.6958
Today Daily Change-0.0012
Today Daily Change %-0.17
Today daily open0.697
 
Trends
Daily SMA200.6892
Daily SMA500.696
Daily SMA1000.7111
Daily SMA2000.7164
 
Levels
Previous Daily High0.6991
Previous Daily Low0.6934
Previous Weekly High0.7033
Previous Weekly Low0.6879
Previous Monthly High0.7033
Previous Monthly Low0.668
Daily Fibonacci 38.2%0.6969
Daily Fibonacci 61.8%0.6956
Daily Pivot Point S10.6939
Daily Pivot Point S20.6909
Daily Pivot Point S30.6883
Daily Pivot Point R10.6996
Daily Pivot Point R20.7022
Daily Pivot Point R30.7052

Author

Sagar Dua

Sagar Dua

FXStreet

Sagar Dua is associated with the financial markets from his college days. Along with pursuing post-graduation in Commerce in 2014, he started his markets training with chart analysis.

More from Sagar Dua
Share:

Editor's Picks

GBP/USD consolidates recent losses around 1.3200

GBP/USD enters a bearish consolidation phase around 1.3200 in early Europe on Wednesday. The pair's rebound remains capped amid a broadly firmer US Dollar and chaotic UK political environment. The focus is now on BoE-speak for fresh trading impetus.

EUR/USD sits at yearly low near 1.1350 on USD strength

EUR/USD sits at yearly lows near 1.1350 in the European morning on Wednesday. The pair remains vulnerable to further declines amid a bullish US Dollar. The Greenback continues to draw support from hawkish Fed bets and US-Iran peace deal uncertainty.

Gold bounces off $4,050 but downside risks persist

Gold rebounds from a nearly two-week low of $4,050 in the early European session on Wednesday. Despite easing inflationary concerns in the face of the recent fall in Crude Oil prices, traders have been pricing in a greater chance of a rate hike by the US Federal Reserve, which will continue to limit the bullion's recovery.

Dogecoin tests a key make-or-break point amid waning retail support

Dogecoin trades below $0.08000 maintaining a steady decline for the seventh straight week. The meme coin is losing its retail strength as DOGE futures Open Interest drops 10% in 24 hours, while institutional demand remains muted with zero inflows so far this week.

Tech rout weighs on US stocks as the USD clocks a fresh 2026 high

Major US equity benchmarks ended Tuesday’s session considerably in the red, with the Nasdaq 100 down 3.3%, the S&P 500 off by 1.4%, and the Dow Jones down 0.1%. Stocks were largely weighed down by tech amid doubts over the AI-driven rally; the Philadelphia Semiconductor Index slid nearly 8%.

Regime change: Inside Kevin Warsh's first move to make the Fed unreadable on purpose

The rate did not move. That was the least interesting thing about Kevin Warsh's first meeting in charge of the Fed. The FOMC held its benchmark at 3.50%-3.75% for the fourth straight meeting, exactly as priced, and then the new chair used his first press conference to dismantle the machinery the market has leaned on for a decade.