|

AUD/USD Price Analysis: Bullish above 0.6650 amid firmer Aussie Retail Sales, pre-Fed USD fall

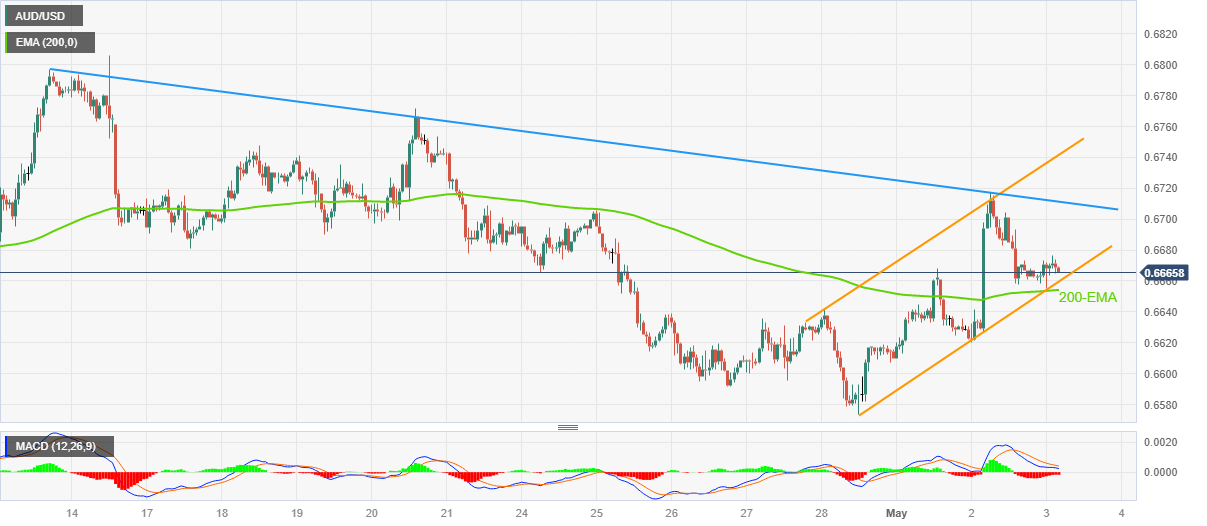
  • AUD/USD clings to mild gains inside weekly bullish channel, keep bounce off 200-EMA.
  • Easing bearish bias of MACD signals adds strength to recovery moves.
  • Three-week-old descending trend line acts as immediate hurdle; downside break of 0.6650 can prod yearly low.

AUD/USD remains mildly bid during a three-day winning streak around 0.6665 heading into Wednesday’s European session.

Also read: AUD/USD remains confined below 0.6670 despite upbeat Australian Retail Sales data

In doing so, the Aussie pair stays within an upward-sloping trend channel while defending the previous day’s rebound from the 200-hour Exponential Moving Average (200-EMA).

That said, the easing bearish bias of the MACD signals and the pair’s sustained trading inside a bullish chart formation, not to forget the clear bounce off 200-EMA, keeps AUD/USD buyers hopeful.

However, the late April swing high near 0.6705 challenges the immediate upside of the Aussie pair, a break of which will highlight a downward-sloping resistance line from April 13, close to 0.6715 at the latest.

In a case where the AUD/USD buyers keep the reins past 0.6715, the stated weekly channel’s top line, near 0.6745 by the press time, as well as the April 25 swing high near 0.6775, could challenge the upside momentum.

On the contrary, a downside break of the stated bullish channel’s support line, near 0.6660, isn’t an open offer for the Aussie bear’s welcome as the 200-EMA level of 0.6650 can prod the AUD/USD pair’s further declines.

Following that, a slump towards the yearly low marked in April, close to 0.6565, can’t be ruled out.

AUD/USD: Hourly chart

Trend: Further upside expected

Additional important levels

Overview
Today last price0.6667
Today Daily Change0.0004
Today Daily Change %0.06%
Today daily open0.6663
 
Trends
Daily SMA200.6678
Daily SMA500.6688
Daily SMA1000.679
Daily SMA2000.6734
 
Levels
Previous Daily High0.6717
Previous Daily Low0.662
Previous Weekly High0.6706
Previous Weekly Low0.6574
Previous Monthly High0.6806
Previous Monthly Low0.6574
Daily Fibonacci 38.2%0.668
Daily Fibonacci 61.8%0.6657
Daily Pivot Point S10.6616
Daily Pivot Point S20.657
Daily Pivot Point S30.652
Daily Pivot Point R10.6713
Daily Pivot Point R20.6764
Daily Pivot Point R30.681

Author

Anil Panchal

Anil Panchal

FXStreet

Anil Panchal has nearly 15 years of experience in tracking financial markets. With a keen interest in macroeconomics, Anil aptly tracks global news/updates and stays well-informed about the global financial moves and their implications.

More from Anil Panchal
Share:

Editor's Picks

EUR/USD drops below 1.1600 on broad USD strength

EUR/USD stays under bearish pressure and trades at a fresh six-week low below 1.1600 on Tuesday. Despite stronger-than-forecast inflation data from the Eurozone, the pair struggles to stage a rebound as the US Dollar continues to attract safe haven flows amid escalating geopolitical tensions in the Middle East. 

GBP/USD attacks 1.3300, refreshing three-month lows

GBP/USD is deep in the red near 1.3300, accelerating its downside to renew three-month lows in European trading on Tuesday. The ongoing escalation in the Iran war, combined with rising Oil prices, weighs negatively on the higher-yielding Pound Sterling as the US Dollar capitalizes on increased haven demand.

Gold drops below $5,200 on stronger USD, rallying US yields

Gold attracts some intraday selling and falls below $5,200 on Tuesday. The US Dollar climbs to a fresh high since January 20 and turns out to be a key factor exerting downward pressure on the commodity. Meanwhile, the benchmark 10-year US Treasury bond yield rises nearly 2% on the day, putting additional weight on XAU/USD's shoulders.

Crypto Today: Bitcoin, Ethereum, XRP pull back as sentiment remains in extreme market fear

The cryptocurrency market is broadly in the red on Tuesday as the Middle East grapples with an escalating war. Bitcoin (BTC) is in a pullback, trading below $67,000 at the time of writing, and most altcoins follow suit.

Middle East conflict ramps up a gear as energy price spike rips through markets

It’s another risk off day as geopolitical headwinds continue to batter financial markets. Although markets calmed during the US session and US stocks managed to post gains on Monday, this has not fed through to the European session, and stocks and bonds are sharply lower for a second day.

Hyperliquid Price Forecast: HYPE rises on commodities demand amid US-Iran war

Hyperliquid (HYPE) steadies above $33 at press time on Tuesday, marking its fourth consecutive day of recovery in a broadly volatile market due to the ongoing US-Israel strikes on Iran.