|

AUD/USD Price Analysis: Bull flag teases run-up to 0.7080

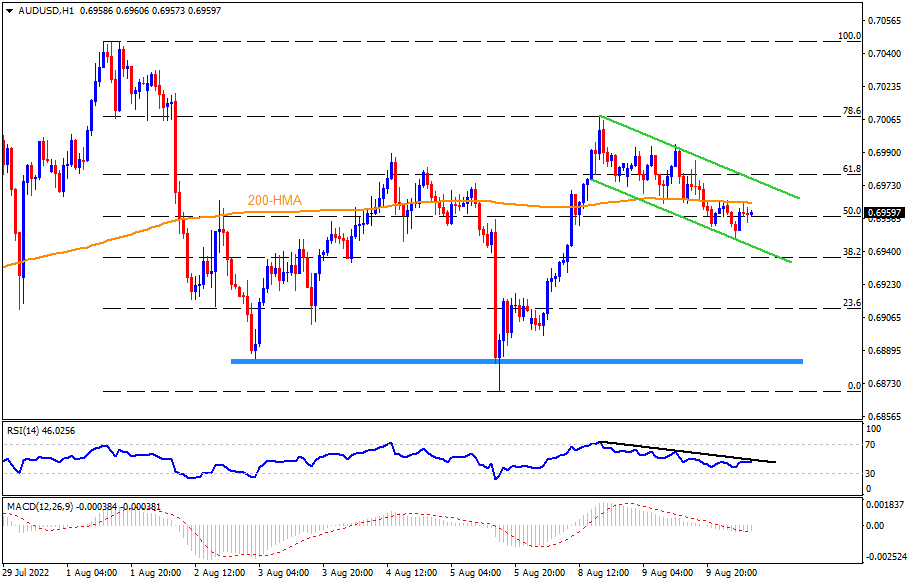
  • AUD/USD remains indecisive below 200-HMA inside bullish chart formation.
  • RSI, MACD hints at further weakness, 200-HMA guards immediate upside.
  • Bulls need validation from 0.6980 resistance, weekly horizontal support tests bears.

AUD/USD retreats to 0.6960 while portraying sluggish moves inside a short-term bull flag. That said, the Aussie pair recently eased from the 200-HMA during Wednesday’s Asian session.

Given the lower high in RSI (14) backing the latest weakness in the AUD/USD prices, as well as the bearish MACD signals, the quote is likely to remain depressed inside a flag, currently between 0.6940 and 0.6980.

It’s worth noting that the 23.6% Fibonacci retracement level of August 01-05 declines, near 0.6910, could test the AUD/USD bears after 0.6940. However, a one-week-old horizontal area near 0.6885 might restrict the Aussie pairs’ further downside.

On the contrary, the 200-HMA level near 0.6965 guards the quote’s immediate recovery.

Following that, the stated flag’s upper line, close to 0.6980 by the press time, holds the key to the AUD/USD pair’s rally.

During the rise, the Aussie pair may take a breather around tops marked on Monday and on August 01, near 0.6995 and 0.7045-50 in that order, ahead of fueling the run-up towards the theoretical target surrounding 0.7080.

AUD/USD: Hourly chart

Trend: Pullback expected

Additional important levels

Overview
Today last price0.6958
Today Daily Change-0.0007
Today Daily Change %-0.10%
Today daily open0.6965
 
Trends
Daily SMA200.6916
Daily SMA500.6946
Daily SMA1000.7096
Daily SMA2000.7156
 
Levels
Previous Daily High0.6995
Previous Daily Low0.6952
Previous Weekly High0.7048
Previous Weekly Low0.6869
Previous Monthly High0.7033
Previous Monthly Low0.668
Daily Fibonacci 38.2%0.6968
Daily Fibonacci 61.8%0.6979
Daily Pivot Point S10.6946
Daily Pivot Point S20.6928
Daily Pivot Point S30.6903
Daily Pivot Point R10.6989
Daily Pivot Point R20.7014
Daily Pivot Point R30.7032

Author

Anil Panchal

Anil Panchal

FXStreet

Anil Panchal has nearly 15 years of experience in tracking financial markets. With a keen interest in macroeconomics, Anil aptly tracks global news/updates and stays well-informed about the global financial moves and their implications.

More from Anil Panchal
Share:

Editor's Picks

EUR/USD gathers traction, approaches 1.1800

EUR/USD manages to reverse Tuesday’s pullback, advancing to two-day highs near the 1.1800 hurdle in the latter part of Wednesday’s session. The pair’s decent uptick comes on the back of the modest retracement in the US Dollar, as investors continue to closely follow developments on the trade front and news from the White House in the wake of President Trump’s SOTU speech.

GBP/USD challenges multi-day highs near 1.3530

GBP/USD leaves behind the previous day’s decline and regains fresh upside traction on Wednesday, surpassing the 1.3500 barrier in a context of a modest decline in the Greenback and a generalised improved mood in the risk-linked space. Meanwhile, the US tariff narrative continues to dictate the mood among market participants after Presidet Trump’s SOTU speech failed to surprise markets.

Gold remains bid and close to $5,200

Gold buyers are returning to the fold on Wednesday, targeting the $5,200 area and possibly beyond, after Tuesday’s corrective dip from monthly highs. The rebound in the precious metal comes as the US Dollar loses traction, with Trump’s SOTU speech offering little fresh direction and AI-related nerves continuing to ease.

Crypto Today: Bitcoin, Ethereum, XRP test rebound strength as ETF inflows return

Bitcoin, Ethereum and Ripple are gaining traction at the time of writing on Wednesday, amid persistent market doldrums. The Crypto King is up over 2% intraday, trading above $65,000 from the day’s opening of $64,058.

Nvidia earnings to influence AI trade and broader market sentiment

For the last three years, Nvidia has been the engine of the AI boom, and now Wall Street is watching to see whether that momentum can keep going. High-growth stocks have been struggling to maintain their bullish trend in 2026.

Cosmos Hub Price Forecast: ATOM rebounds slightly, bearish outlook remains intact

Cosmos Hub (ATOM) price rebounds, trading above $2.05 at the time of writing on Wednesday, after undergoing a sharp correction since last week. Weakening on-chain and derivatives data support a bearish outlook, while technical analysis remains unfavorable.