|

AUD/USD Price Analysis: Bull Flag continuation pattern possibly forming

  • AUD/USD might be forming a bullish continuation pattern on the four-hour chart.
  • A break above the 0.6714 high could confirm a continuation of the short-term uptrend. 
  • A break below the red trendline would bring into question the dominant uptrend. 

AUD/USD is rising in a channel in a short-term uptrend that is biased to extend, given the old adage that “the trend is your friend”. 

The Aussie is potentially forming a Bull Flag continuation pattern on the four-hour chart. 

A break above the top of the consolidation that represents the “flag square” (shaded rectangle on chart below) and the 0.6714 May 16 highs, would confirm activation of the Bull Flag and a continuation of the short-term uptrend up to an initial target at 0.6728. Further bullishness could even see price rise to 0.6788. 

AUD/USD 4-hour Chart

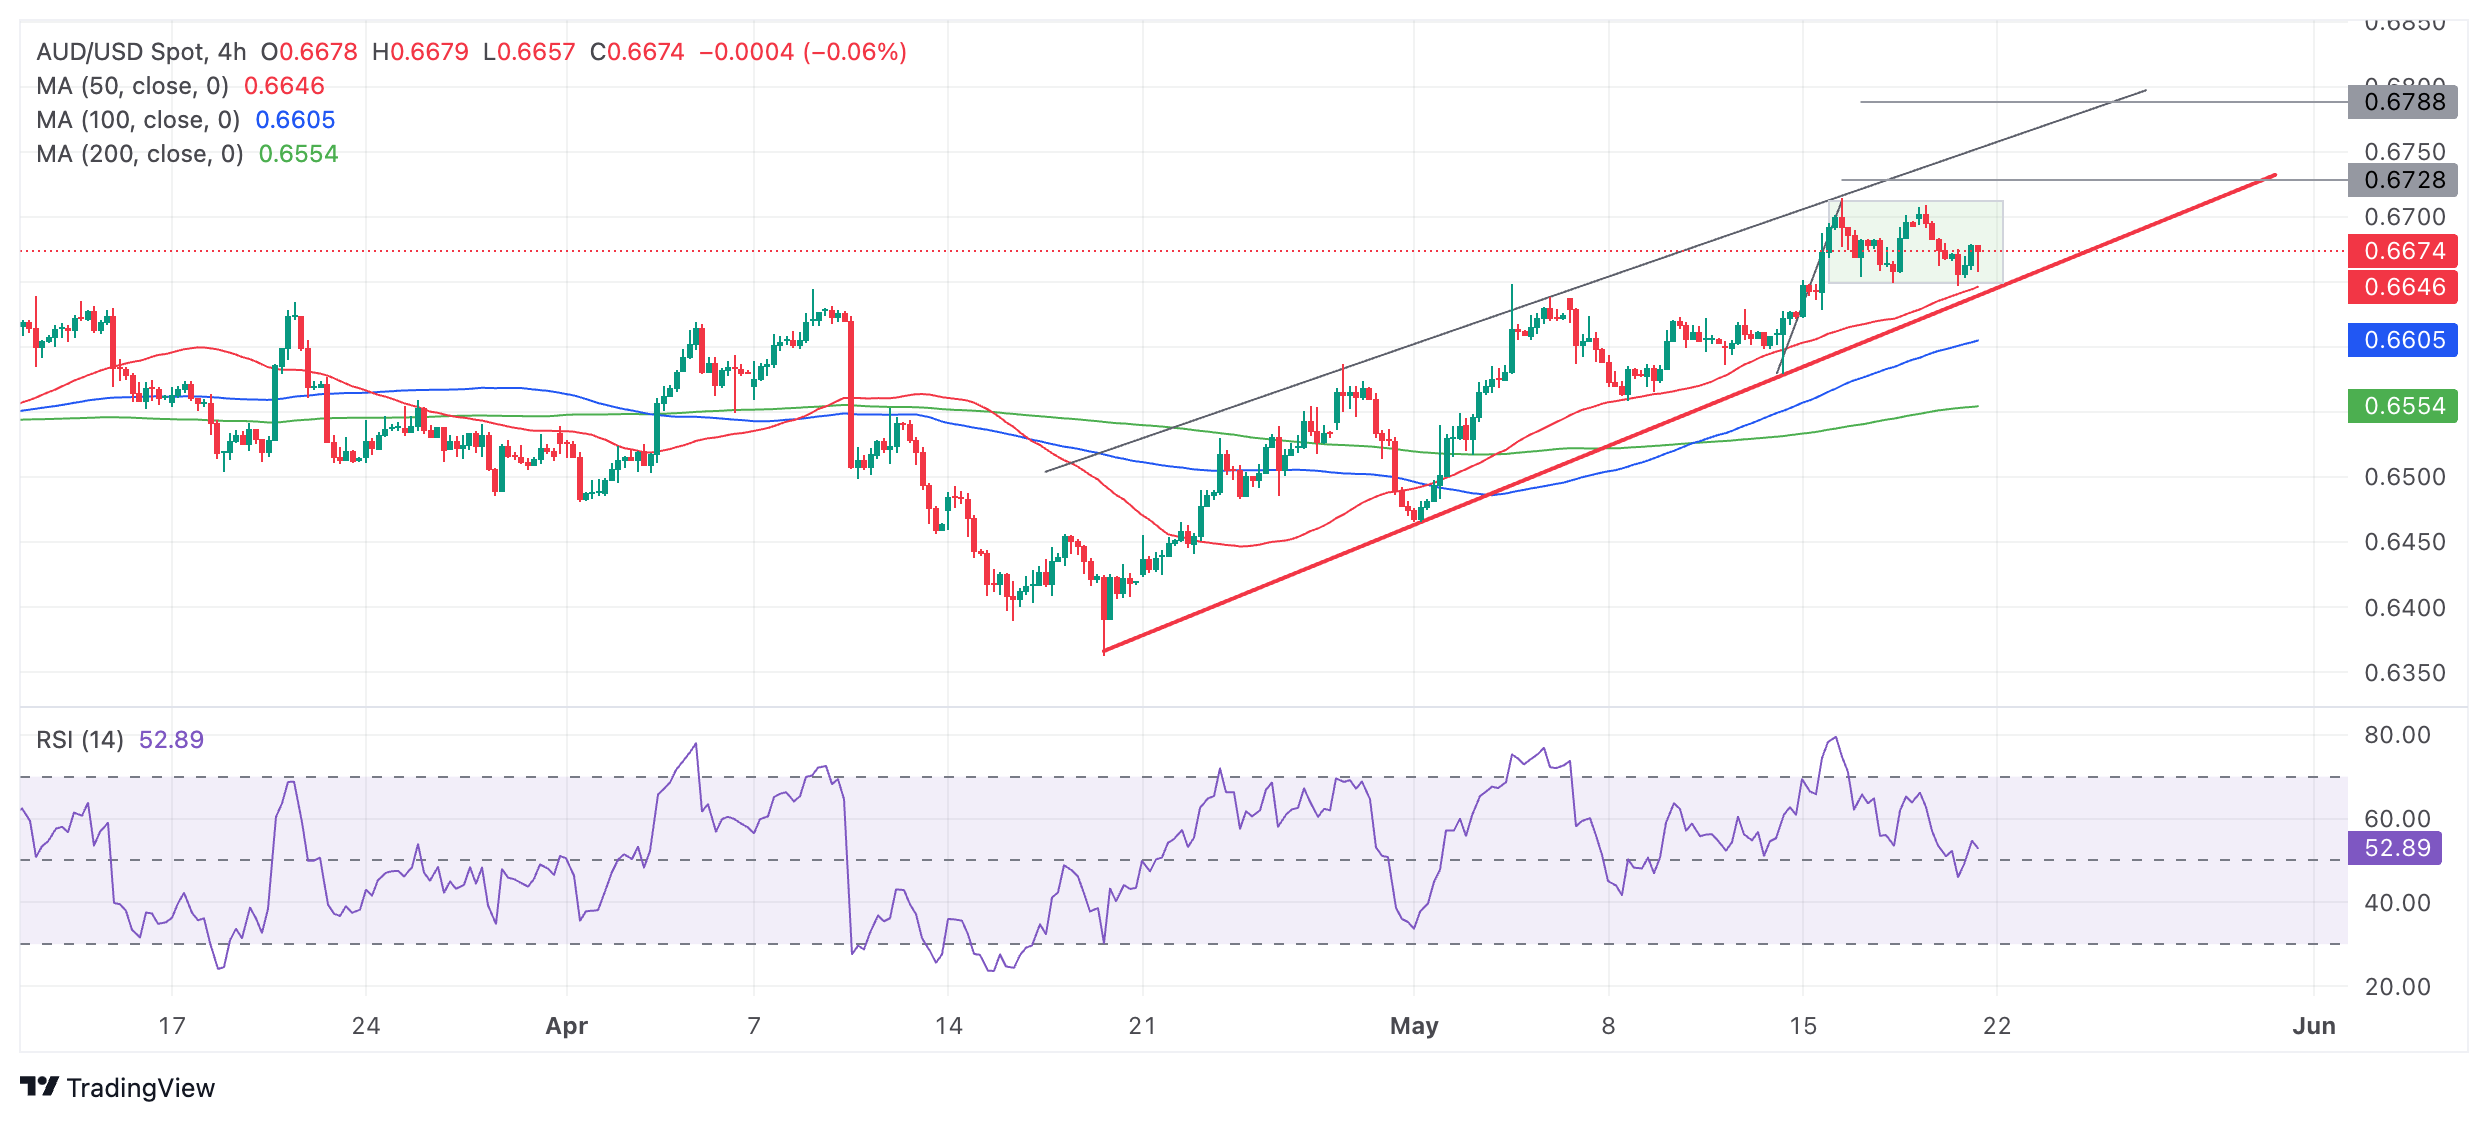
The Aussie is in a short-term uptrend indicated by the rising peaks and troughs on the four-hour chart since the April 19 lows. 

A decisive break below the red trendline would be a bearish sign which could denote a change of the short-term trend.

Decisive would be characterized as a break that was accompanied by a long red candle that closed near its low or three red candles in a row that broke through the trendline.

Author

Joaquin Monfort

Joaquin Monfort is a financial writer and analyst with over 10 years experience writing about financial markets and alt data. He holds a degree in Anthropology from London University and a Diploma in Technical analysis.

More from Joaquin Monfort
Share:

Markets move fast. We move first.

Orange Juice Newsletter brings you expert driven insights - not headlines. Every day on your inbox.

By subscribing you agree to our Terms and conditions.

Editor's Picks

EUR/USD could test 1.1750 amid strengthening bullish bias

EUR/USD remains flat after two days of small losses, trading around 1.1740 during the Asian hours on Thursday. On the daily chart, technical analysis indicates a strengthening of a bullish bias, as the pair continues to trade within an ascending channel pattern.

GBP/USD consolidates above mid-1.3300s as traders await BoE and US CPI report

The GBP/USD pair struggles to capitalize on the overnight bounce from the 1.3310 area, or a one-week low, and oscillates in a narrow band during the Asian session on Thursday. Spot prices currently trade around the 1.3370 region, down less than 0.10% for the day, as traders opt to wait on the sidelines ahead of the key central bank event risk and US consumer inflation data.

Gold awaits weekly trading range breakout ahead of US CPI report

Gold struggles to capitalize on the previous day's move higher back closer to the $4,350 level and trades with a mild negative bias during the Asian session on Thursday. The downtick could be attributed to some profit-taking amid a US Dollar uptick, though it is likely to remain cushioned on the back of a supportive fundamental backdrop. 

Dogecoin breaks key support amid declining investor confidence

Dogecoin trades in the red on Thursday, following a 4% decline on the previous day. The DOGE supply in profit declines as large wallet investors trim their portfolios. Derivatives data shows a surge in bearish positions amid declining retail interest.

Monetary policy: Three central banks, three decisions, the same caution

While the Fed eased its monetary policy on 10 December for the third consecutive FOMC meeting, without making any guarantees about future action, the BoE, the ECB and the BoJ are holding their respective meetings this week. 

Dogecoin Price Forecast: DOGE breaks key support amid declining investor confidence

Dogecoin (DOGE) trades in the red on Thursday, following a 4% decline on the previous day. The DOGE supply in profit declines as large wallet investors trim their portfolios. Derivatives data shows a surge in bearish positions amid declining retail interest.