AUD/USD Price Analysis: Bounces off lows, still in the red around 0.7765 area
- The prevalent USD selling bias assisted AUD/USD to trim a part of its intraday losses.
- The making of a head and shoulders pattern on the daily chart favours bearish trades.
- Neutral technical indicators warrant some caution before placing fresh directional bets.

The AUD/USD pair managed to recover around 25-30 pips from early European session lows and was last seen trading with only modest losses, around the 0.7760-65 region.
The US dollar languished near multi-month lows amid expectations that the Fed would retain its accommodative policy stance for a longer period and the ongoing decline in the US Treasury bond yields. This, along with the prevalent risk-on mood, further undermined the safe-haven USD and extended some support to the perceived riskier aussie.
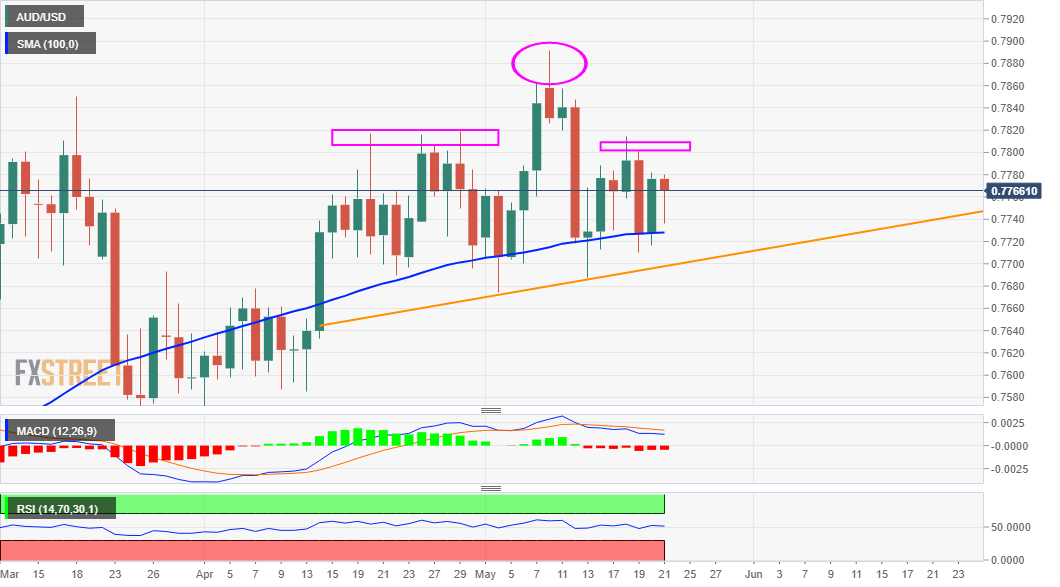
Looking at the technical picture, the recent price action seemed to constitute the formation of a bearish head & shoulders on the daily chart. The pattern, however, is not complete until the neckline support, currently around the 0.7700 mark, is broken decisively. This, in turn, should now act as a key pivotal point for short-term traders.
Meanwhile, neutral technical indicators on 4-hour/daily charts haven't been supportive of any firm direction. This further makes it prudent to wait for a sustained break below the mentioned support before positioning for any further depreciating move. The next relevant support is pegged near monthly swing lows, around the 0.7675 region.
Some follow-through selling will reaffirm the bearish breakdown and turn the AUD/USD pair vulnerable to accelerate the fall towards the 0.7600 mark. The downward trajectory could further get extended towards YTD lows, around the 0.7530 region, touched on April 1, before the pair eventually drops to challenge the key 0.7500 psychological mark.
On the flip side, the 0.7795-0.7800 region is likely to act as an immediate resistance ahead of the 0.7815-20 supply zone. A sustained strength beyond will negate the bearish set-up and trigger some short-covering move. Bulls might then push the AUD/USD pair beyond an intermediate hurdle near the 0.7840-45 area and attempt a move to reclaim the 0.7900 mark.
AUD/USD daily chart
Technical levels to watch
Author

Haresh Menghani
FXStreet
Haresh Menghani is a detail-oriented professional with 10+ years of extensive experience in analysing the global financial markets.
















