- AUD/USD bears breaking 4-hour supporting trendline.
- 0.6650 and then 0.6580 will be key milestones to leave the bears fully in control with 0.6550 and 0.6500 eyed.
Protests against China's strict zero-COVID policy and restrictions on freedoms in the nation have led to a risk-off start to the week, weighing head8ily on the Aussie as the following technical analysis will show. AUD/USD is currently down some 1.13% having lost its footing from a high of 0.6727 to a low of 0.6665 on the day so far.
AUD/USD daily chart
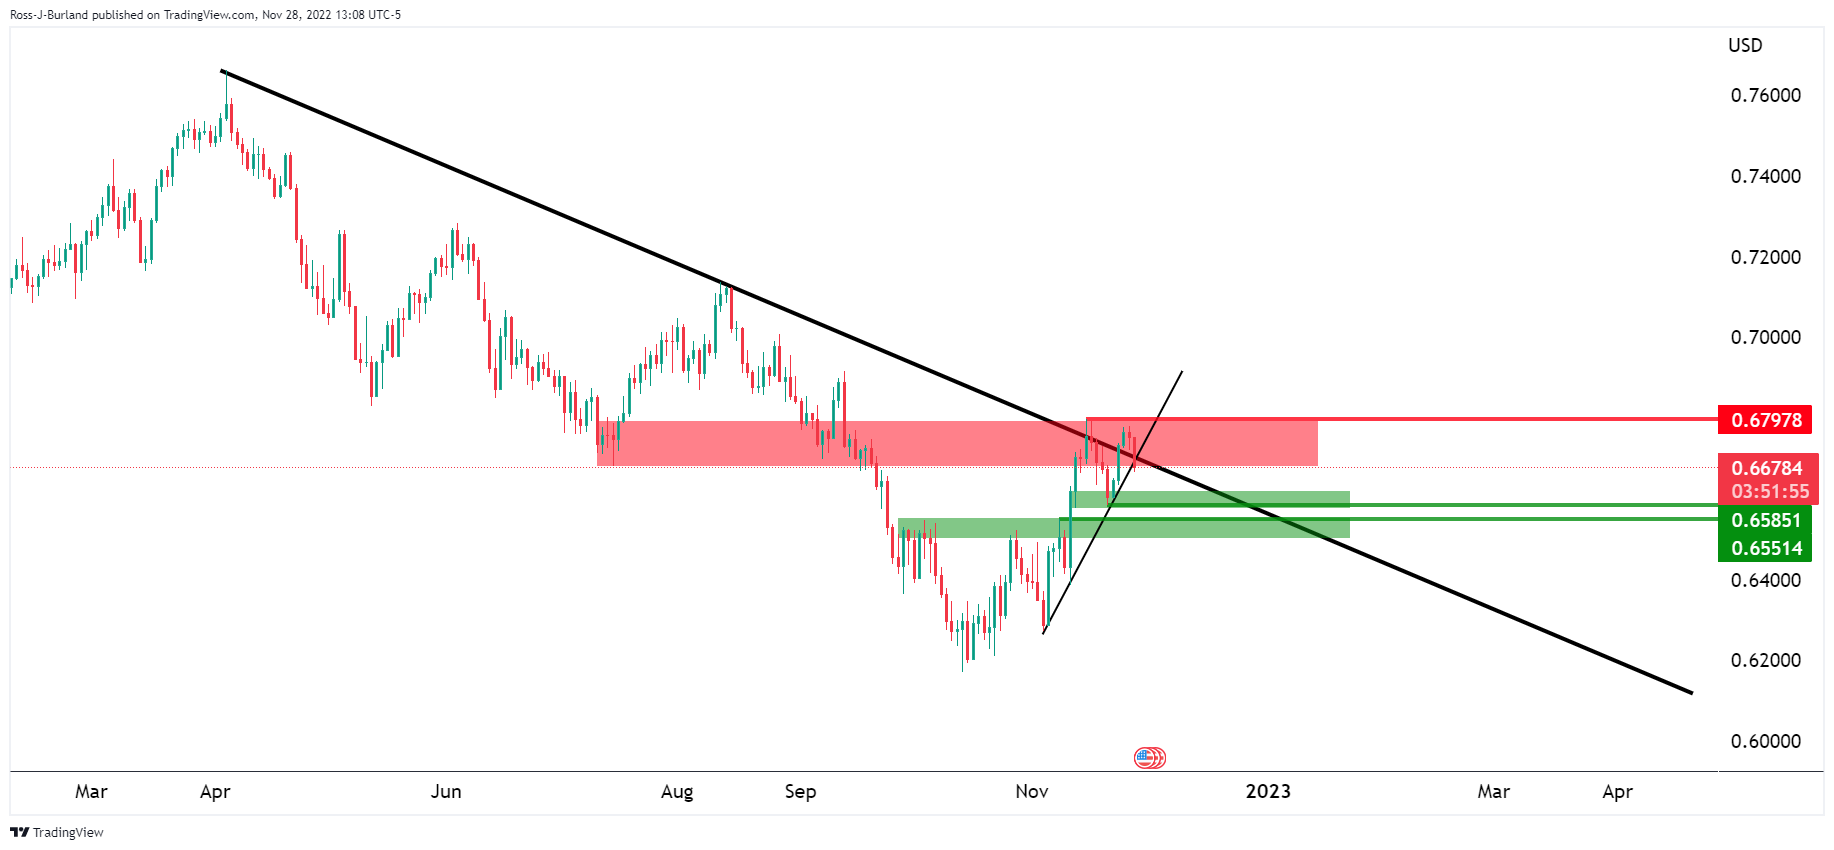
The price is testing a meanwhile trendline support on the daily chart, with resistance in a double top at the daily structure, as shown on the chart above. The bias is on the downside as follows:
AUD/USD H4 chart
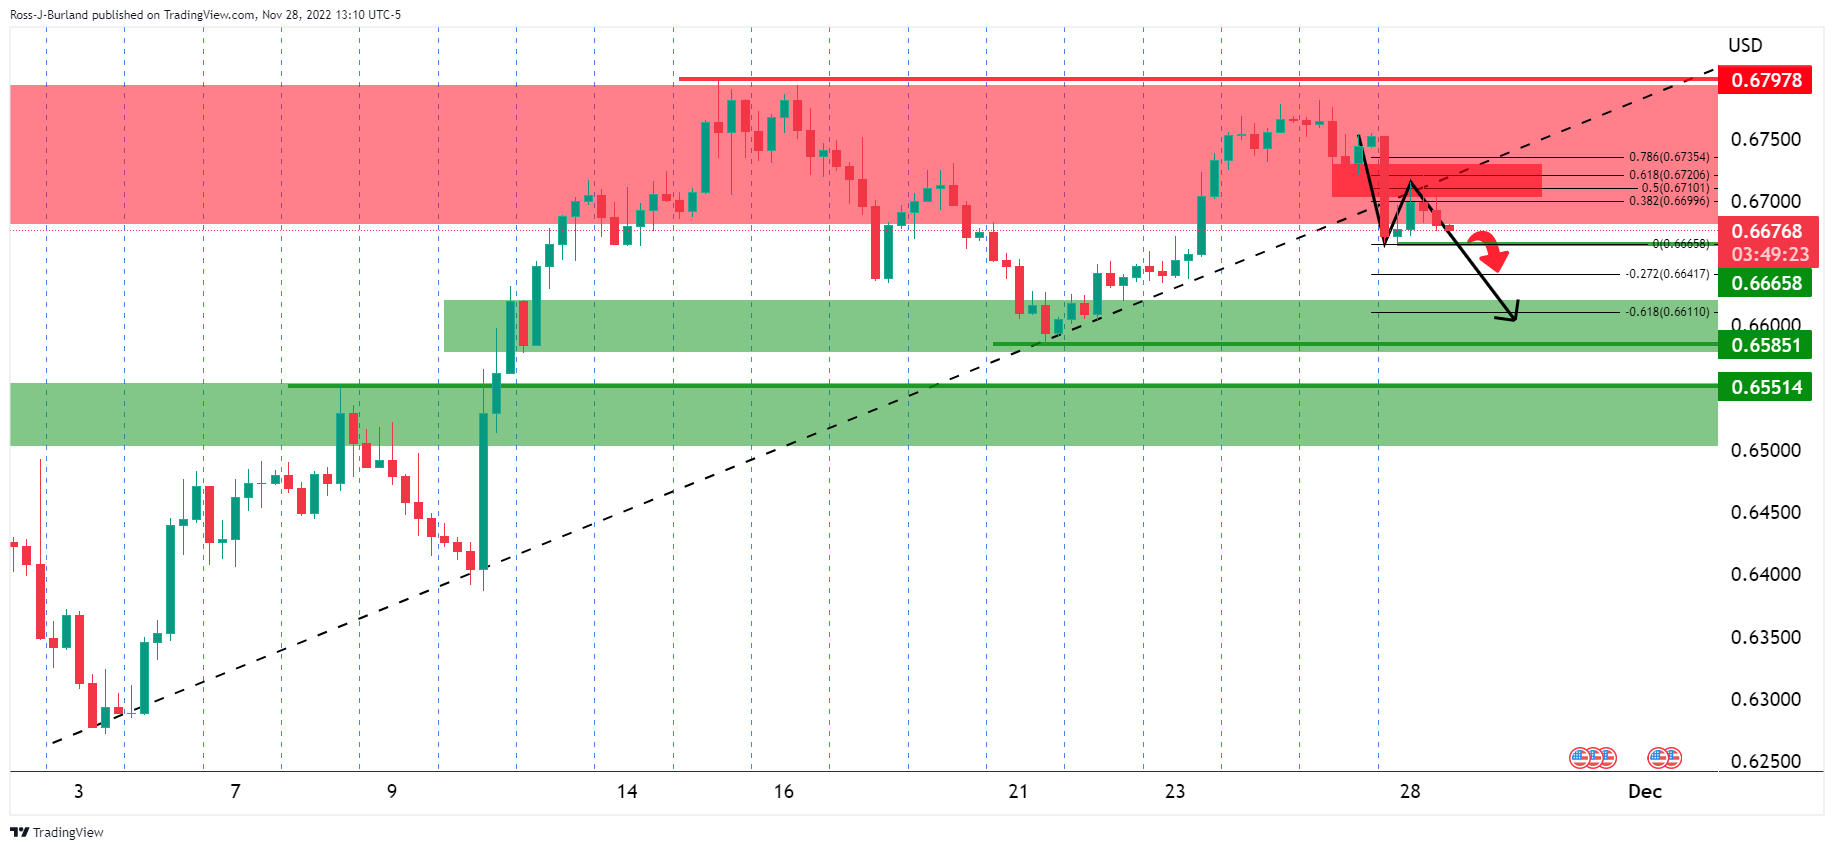
The 4-hour time frame sees the price testing below the trendline and after a correction into the Fibonacci scale, the bears have moved back in. This puts the focus on the recent lows of 0.6665. However, it will not be until the price break below 0.6650 and then 0.6580 that the bears will be in fully control with 0.6550 and 0.6500 eyed.
Information on these pages contains forward-looking statements that involve risks and uncertainties. Markets and instruments profiled on this page are for informational purposes only and should not in any way come across as a recommendation to buy or sell in these assets. You should do your own thorough research before making any investment decisions. FXStreet does not in any way guarantee that this information is free from mistakes, errors, or material misstatements. It also does not guarantee that this information is of a timely nature. Investing in Open Markets involves a great deal of risk, including the loss of all or a portion of your investment, as well as emotional distress. All risks, losses and costs associated with investing, including total loss of principal, are your responsibility. The views and opinions expressed in this article are those of the authors and do not necessarily reflect the official policy or position of FXStreet nor its advertisers. The author will not be held responsible for information that is found at the end of links posted on this page.
If not otherwise explicitly mentioned in the body of the article, at the time of writing, the author has no position in any stock mentioned in this article and no business relationship with any company mentioned. The author has not received compensation for writing this article, other than from FXStreet.
FXStreet and the author do not provide personalized recommendations. The author makes no representations as to the accuracy, completeness, or suitability of this information. FXStreet and the author will not be liable for any errors, omissions or any losses, injuries or damages arising from this information and its display or use. Errors and omissions excepted.
The author and FXStreet are not registered investment advisors and nothing in this article is intended to be investment advice.
Recommended content
Editors’ Picks
EUR/USD recovers modestly from 2023-low, trades below 1.0500

EUR/USD dropped to a fresh 2023-low near 1.0450 on Tuesday before staging a modest rebound. After the data from the US showed that the number of job openings rose unexpectedly in August, the US Dollar extended its rally and caused the pair to turn south in the American session.
GBP/USD holds above 1.2050 after US data

GBP/USD fell sharply to the 1.2050 area with the immediate reaction to the US job openings data but managed to its losses. As safe-haven flows continue to dominate the financial markets, however, the pair finds it difficult to gather recovery momentum.
Gold moves closer to $1,800 amid risk-off flows Premium

Gold price stays under modest bearish pressure and trades below $1,830 in the second half of the day on Tuesday. The benchmark 10-year US Treasury bond yield holds at fresh multi-year highs above 4.7% after upbeat US data, not allowing XAU/USD to gain traction.
Chainlink price still trapped in range despite exhausted macro downtrend

Chainlink price eyes the upper boundary of a range at $8.148. It comes after the macro downtrend concluded, and could be the path to a new confirmed macro uptrend for LINK.
S&P 500 Forecast: 4,300 becomes resistance for lagging index

S&P 500 lost 0.74% last week, its fourth consecutive losing streak. Equity index stayed uncertain and closed flat on Monday. Tuesday begins with index shedding ground once more as 4,300 turns into resistance.