|

AUD/USD Price Analysis: Bears are making their move

  • Bears remain below the counter-trendline resistance which leaves the focus on the downside.
  • AUD/USD bears could be about to move in for a run to 0.6800. 

AUD/USD bulls have so far committed but the counter trendline resistance is keeping them in check. The following illustrates the price structures on a 4-hour time frame and the prospects of a breakdown of the same for the coming sessions. 

AUD/USD H4 chart

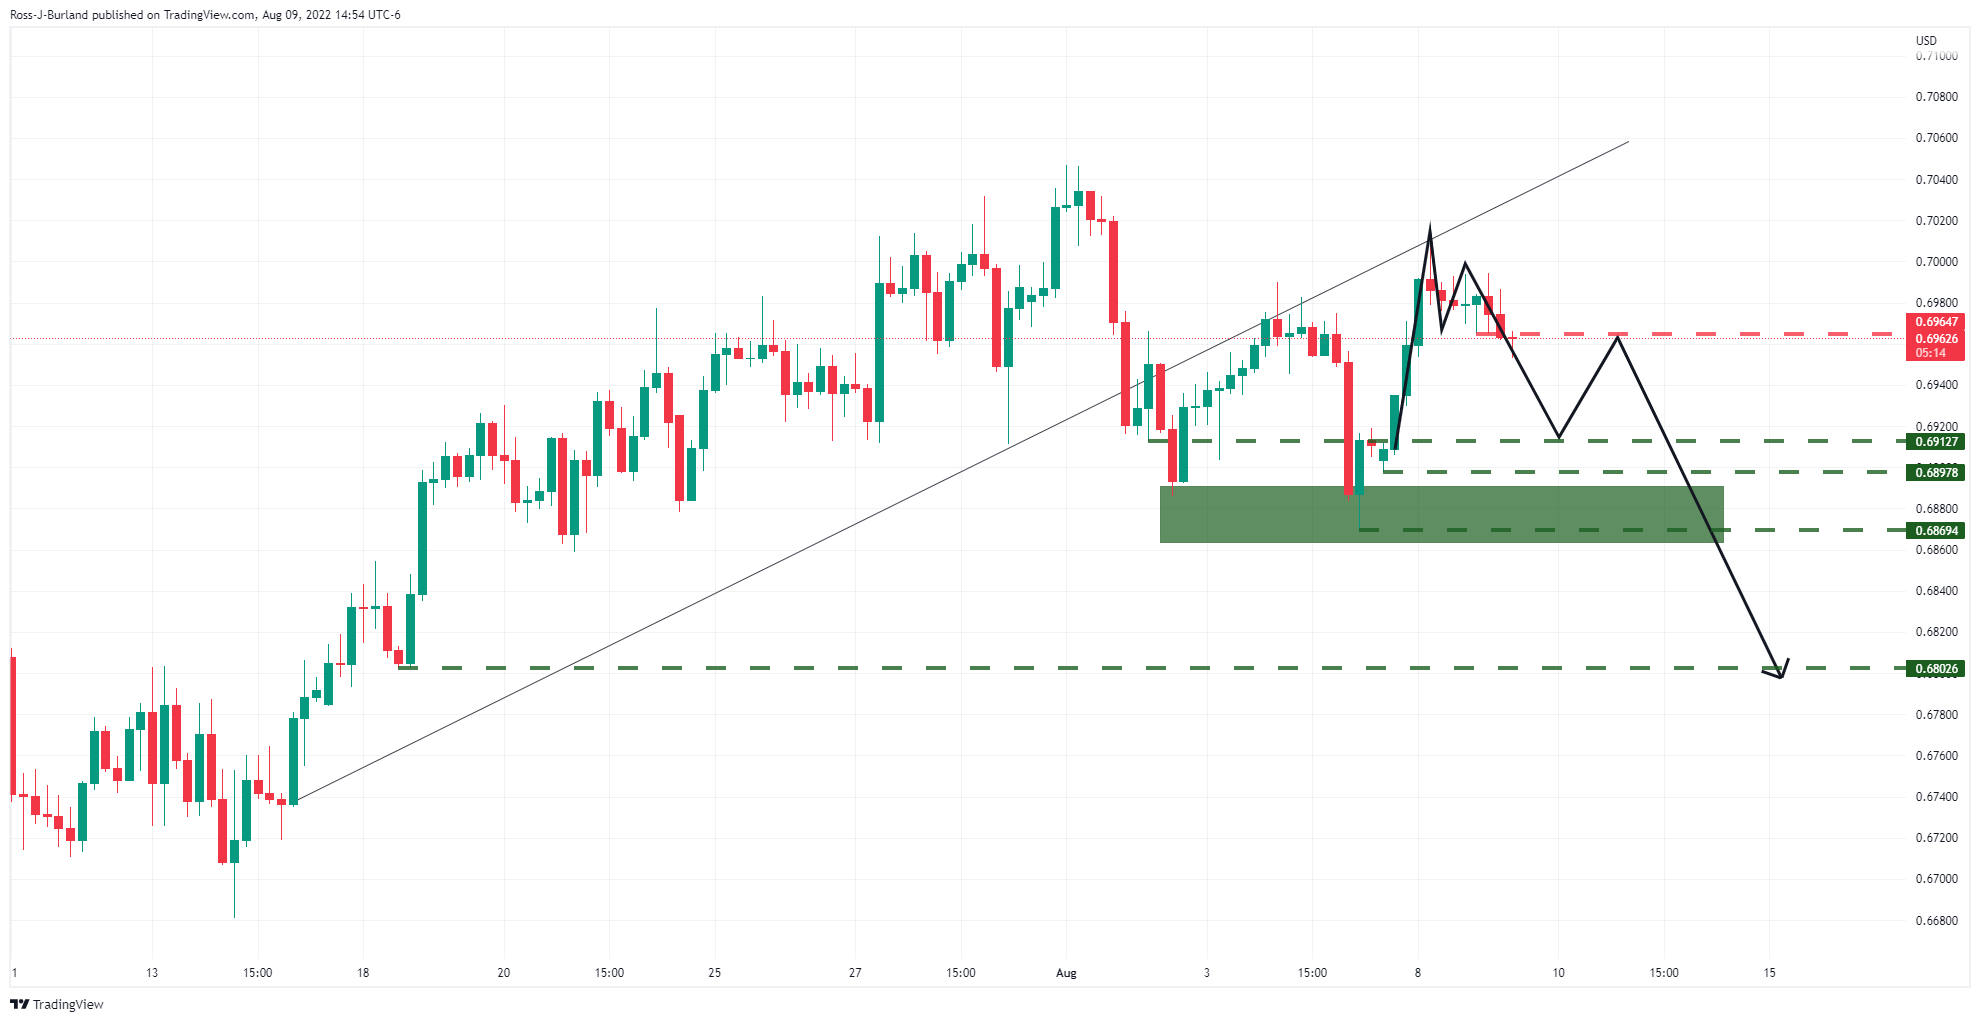
As illustrated, the price is being rejected by the counter trendline resistance and is forking the makings of an M-formation in the process. A break to the downside will open the risk of a test to 0.6920/10 which could leave the price trapped between there and the neckline of the M-pattern around 0.6965. A break of 0.6900, on the other hand, opens the risk of a continuation of the bearish breakout towards 0.68 the figure for the days ahead. 

Author

Ross J Burland

Ross J Burland, born in England, UK, is a sportsman at heart. He played Rugby and Judo for his county, Kent and the South East of England Rugby team.

More from Ross J Burland
Share:

Editor's Picks

EUR/USD tests nine-day EMA support near 1.1850

EUR/USD remains in the negative territory for the fourth successive session, trading around 1.1870 during the Asian hours on Friday. The 14-day Relative Strength Index momentum indicator at 56 stays above the midline, confirming steady momentum. RSI has eased but remains above 50, indicating momentum remains constructive for the bulls.

GBP/USD consolidates around 1.3600 vs. USD; looks to US CPI for fresh impetus

The GBP/USD pair remains on the defensive through the Asian session on Friday, though it lacks bearish conviction and holds above the 1.3600 mark as traders await the release of the US consumer inflation figures before placing directional bets.

Gold recovers swiftly from weekly low, climbs back closer to $5,000 ahead of US CPI

Gold regains positive traction during the Asian session on Friday and recovers a part of the previous day's heavy losses to the $4,878-4,877 region, or the weekly low. The commodity has now moved back closer to the $5,000 psychological mark as traders keenly await the release of the US consumer inflation figures for more cues about the Federal Reserve's policy path.

Solana: Mixed market sentiment caps recovery

Solana is trading at $79 as of Friday, following a correction of over 9% so far this week. On-chain and derivatives data indicates mixed sentiment among traders, further limiting the chances of a price recovery.

A tale of two labour markets: Headline strength masks underlying weakness

Undoubtedly, yesterday’s delayed US January jobs report delivered a strong headline – one that surpassed most estimates. However, optimism quickly faded amid sobering benchmark revisions.

Solana Price Forecast: Mixed market sentiment caps recovery

Solana (SOL) is trading at $79 as of Friday, following a correction of over 9% so far this week. On-chain and derivatives data indicates mixed sentiment among traders, further limiting the chances of a price recovery.