|

AUD/USD Price Analysis: Ascending triangle breakout, bull cross call for a retest of 0.7315

  • AUD/USD retreats from two-month highs before initiating fresh upside.
  • The US dollar keeps its downbeat momentum intact ahead of key US data.
  • Daily technical setup favors bulls, as the aussie ignores mixed China’s trade figures.

AUD/USD is looking to extend the rebound to test 0.7300 after basing out near 0.7265 in the Asian trades.

Mixed Chinese trade figures for December failed to hinder the aussie’s renewed upside, mainly driven by the broad weakness in the US dollar in the face of the 40-year high inflation levels.

The aussie also ignores the risk-off trading in the global equities, with the recovery gaining ground ahead of the US Retail Sales and Consumer Sentiment data.

AUD/USD: Technical outlook

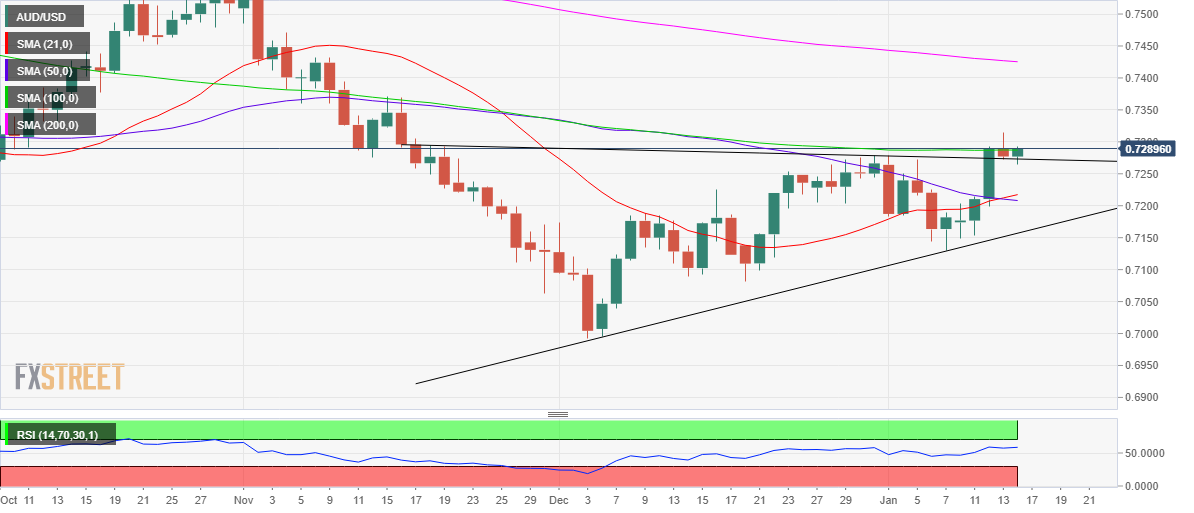
AUD/USD: Daily chart

Technically, the pair is gathering pace to extend the upside breakout from an ascending triangle confirmed on Wednesday.

The 21 and 50-Daily Moving Averages (DMA) bullish crossover also remains in favor of AUD bulls.

Strong resistance is seen at 0.7300, followed by two-month highs of 0.7315. Further up, the bulls may challenge the 0.7350 psychological barrier.  

The 14-day Relative Strength Index (RSI) is gradually inching higher above the midline, justifying the bounce in the spot.

Although buyers need to find acceptance above the 100-DMA at 0.7288 to push northwards.

Alternatively, the corrective pullback will likely remain capped near-daily lows, below which the 0.7200 level could be eyed.

AUD/USD: Additional levels to consider

AUD/USD

Overview
Today last price0.7289
Today Daily Change0.0012
Today Daily Change %0.16
Today daily open0.7277
 
Trends
Daily SMA200.7214
Daily SMA500.721
Daily SMA1000.7287
Daily SMA2000.7427
 
Levels
Previous Daily High0.7315
Previous Daily Low0.7272
Previous Weekly High0.7278
Previous Weekly Low0.713
Previous Monthly High0.7278
Previous Monthly Low0.6993
Daily Fibonacci 38.2%0.7289
Daily Fibonacci 61.8%0.7299
Daily Pivot Point S10.7261
Daily Pivot Point S20.7246
Daily Pivot Point S30.7219
Daily Pivot Point R10.7304
Daily Pivot Point R20.7331
Daily Pivot Point R30.7346

Author

Dhwani Mehta

Dhwani Mehta

FXStreet

Residing in Mumbai (India), Dhwani is a Senior Analyst and Manager of the Asian session at FXStreet. She has over 10 years of experience in analyzing and covering the global financial markets, with specialization in Forex and commodities markets.

More from Dhwani Mehta
Share:

Editor's Picks

EUR/USD remains heavy near 1.1600 after hot EU inflation data

EUR/USD remains heavily offered near 1.1600, six-week lows, in the European session on Tuesday. The pair fails to find any inspiration from a surprise pick up in Eurozone inflation for February, as the US Dollar continues to attract safe haven flows amid escalating geopolitical tensions in the Middle East. 

GBP/USD attacks 1.3300, refreshing three-month lows

GBP/USD is deep in the red near 1.3300, accelerating its downside to renew three-month lows in European trading on Tuesday. The ongoing escalation in the Iran war, combined with rising Oil prices, weighs negatively on the higher-yielding Pound Sterling as the US Dollar capitalizes on increased haven demand.

Gold falls below $5,300 as stronger USD counter Middle East woes

Gold attracts some intraday selling and falls below $5,300 on Tuesday. The US Dollar climbs to a fresh high since January 20 and turns out to be a key factor exerting downward pressure on the commodity. However, concerns about a broader regional conflict in the Middle East continue to weigh on investors' sentiment and underpin demand for the traditional safe-haven bullion.

Stellar risks deeper losses as derivatives metrics turn negative

Stellar is trading red below $0.16 at the time of writing on Tuesday, after a slight recovery the previous day. Weakening derivatives data caps the recovery, while an unfavorable technical outlook projects a deeper correction for the XLM token in the upcoming days.

The market is not panicking it is repricing the probability distribution of Oil and time

At the end of the day, markets do not trade morality or geopolitics. They trade transmission channels. And the only channel that truly matters in this maelstrom runs through the price of energy and the time value of money.

Hyperliquid Price Forecast: HYPE rises on commodities demand amid US-Iran war

Hyperliquid (HYPE) steadies above $33 at press time on Tuesday, marking its fourth consecutive day of recovery in a broadly volatile market due to the ongoing US-Israel strikes on Iran.