AUD/USD mixed technical signals amid fundamental headwinds
- The AUD/USD pair remains near the bottom of its daily range, reflecting cautious sentiment amid mixed technical signals.
- US inflation data and currency policy discussions between the US and South Korea continue to weigh on the broader US Dollar.
- Key technical levels include support around 0.6420 and resistance near 0.6459, with momentum indicators reflecting a neutral bias.

The AUD/USD pair is trading near the lower end of its daily range, reflecting a mixed technical outlook. The US Dollar Index (DXY), which tracks the performance of the US Dollar (USD) against six major currencies, has dipped toward the 100.60 area, pressured by soft US inflation data and speculation about a possible dovish shift from the Federal Reserve (Fed). US officials recently downplayed speculation about a deliberate dollar-weakening strategy, but concerns persist as trade discussions with South Korea suggest room for stronger local currencies. This uncertainty has contributed to broader US Dollar weakness, affecting pairs like AUD/USD.
Technical Analysis
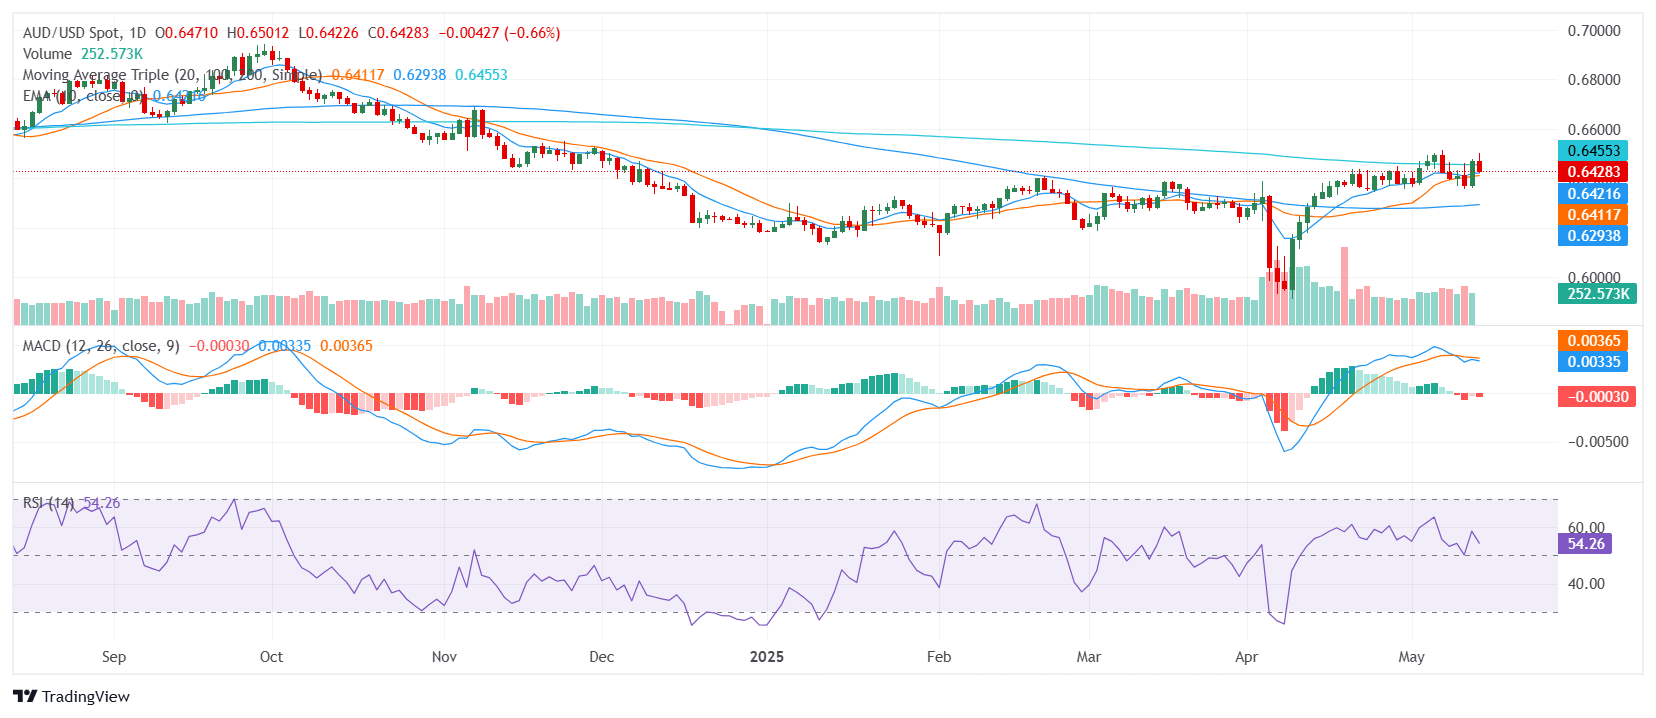
From a technical standpoint, the AUD/USD pair maintains a mixed outlook. The Relative Strength Index (RSI) hovers in the 50s, indicating neutral momentum, while the Moving Average Convergence Divergence (MACD) signals bearish momentum. The Stochastic RSI Fast (3, 3, 14, 14) and Stochastic %K (14, 3, 3) also reflect neutral conditions, with both indicators sitting in the 30s and 40s, respectively. Meanwhile, the 20-day and 100-day Simple Moving Averages (SMAs) provide buy signals, contrasting with the 200-day SMA’s bearish outlook. The 10-day and 30-day Exponential Moving Averages (EMAs) reinforce this split, aligning with the short-term bullish sentiment but conflicting with the longer-term outlook.
Support levels are noted around 0.6420, 0.6415, and 0.6413, while resistance lies near 0.6430 and 0.6459, suggesting the pair is currently caught in a tight range. A breakout above the 0.6459 level could confirm renewed bullish momentum, while a drop below 0.6413 might signal a deeper correction.
Daily Chart
Author

Patricio Martín
FXStreet
Patricio is an economist from Argentina passionate about global finance and understanding the daily movements of the markets.


