AUD/USD jumps to six-week high as weak US NFP cement Fed cut
- AUD/USD hits 0.6588 peak after the US adds just 22K jobs in August, well below 75K forecast.
- Unemployment rate rises to 4.3% as wage growth steadies; traders fully price September 25 bps Fed cut.
- Markets eye the US CPI next week, while the AUD outlook hinges on China data and domestic consumer sentiment.
AUD/USD rallies to a six-week high of 0.6588 after the latest Nonfarm Payrolls report in the United States (US), which had cemented the case that the Federal Reserve (Fed) would cut rates at the September meeting.
Aussie rallies 0.40% to 0.6565 after soft NFP data drives Dollar lower and September Fed easing bets higher
The US Bureau of Labor Statistics (BLS) revealed that the economy added just 22K jobs in August, below the 75K projected by economists, down from the 79K upwardly revised. Digging into the data, the Average Hourly Earnings remained unchanged at 0.3% MoM as expected, while the Unemployment Rate rose to 4.3% up from 4.2% in July.
Following the data, market participants had priced in 67 basis points of easing by the Federal Reserve, towards the year-end, according to the December 2025 Fed funds rate futures contract.
For the September meeting, traders had fully priced in a 25-basis-point rate cut. Odds for 50 bps are at 14% ahead of next week’s release of the Consumer Price Index (CPI) for August. A continuation of the disinflation process could increase the odds for a big-sized rate cut by the Fed.
At the same time, movements in the Australian Dollar (AUD) are currently influenced by fluctuations in the US Dollar. Next week, the economic docket will feature the Westpac Consumer Confidence and the influence of Chinese economic data.
AUD/USD Price Forecast: Technical outlook
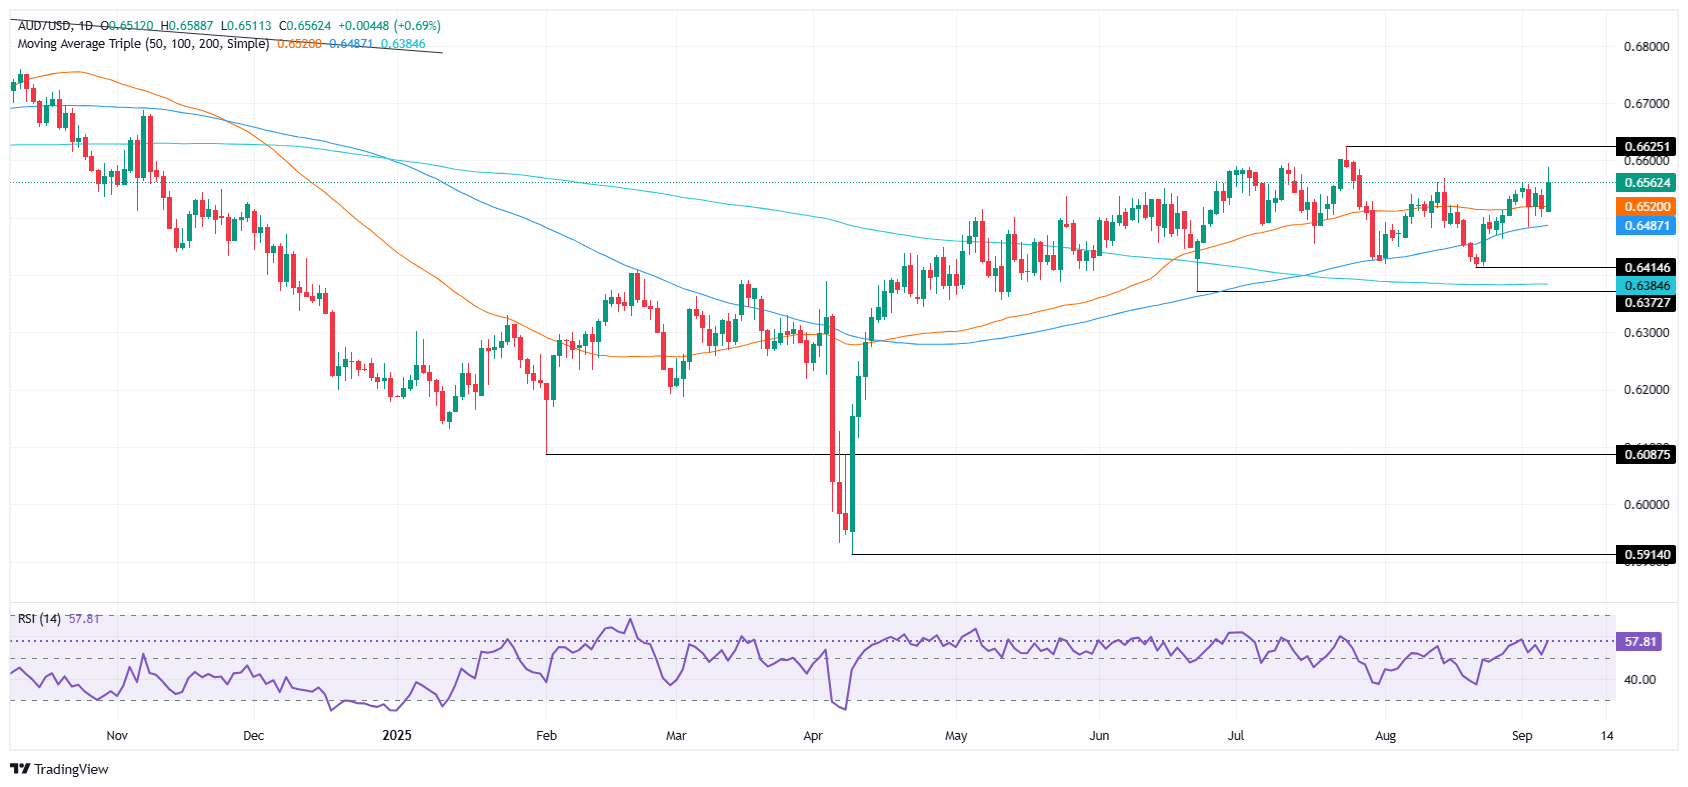
Despite hitting a multi-week high, AUD/USD has retreated toward the 0.6560 area, with buyers remaining unable to crack the 0.6600 figure. Momentum shows that buyers remain in charge, as depicted by the Relative Strength Index (RSI).
If traders clear 0.6600, the next stop would be the July 24 high at 0.6625. On further strength, the Aussie would be set for new yearly highs, with the next key resistance area being 0.6650 and 0.6700. Conversely, a daily close below 0.6550 will expose the 50-day SMA at 0.6520, followed by the 20-day SMA at 0.6506 and the 100-day SMA at 0.6487.
Australian Dollar Price This week
The table below shows the percentage change of Australian Dollar (AUD) against listed major currencies this week. Australian Dollar was the strongest against the Canadian Dollar.
| USD | EUR | GBP | JPY | CAD | AUD | NZD | CHF | |
|---|---|---|---|---|---|---|---|---|
| USD | -0.41% | -0.23% | -0.04% | 0.74% | -0.23% | -0.19% | -0.34% | |
| EUR | 0.41% | 0.18% | 0.33% | 1.15% | 0.18% | 0.22% | 0.07% | |
| GBP | 0.23% | -0.18% | 0.02% | 0.97% | -0.01% | 0.04% | -0.07% | |
| JPY | 0.04% | -0.33% | -0.02% | 0.84% | -0.18% | -0.13% | -0.28% | |
| CAD | -0.74% | -1.15% | -0.97% | -0.84% | -0.95% | -0.92% | -1.02% | |
| AUD | 0.23% | -0.18% | 0.00% | 0.18% | 0.95% | 0.04% | -0.06% | |
| NZD | 0.19% | -0.22% | -0.04% | 0.13% | 0.92% | -0.04% | -0.10% | |
| CHF | 0.34% | -0.07% | 0.07% | 0.28% | 1.02% | 0.06% | 0.10% |
The heat map shows percentage changes of major currencies against each other. The base currency is picked from the left column, while the quote currency is picked from the top row. For example, if you pick the Australian Dollar from the left column and move along the horizontal line to the US Dollar, the percentage change displayed in the box will represent AUD (base)/USD (quote).
Author

Christian Borjon Valencia
FXStreet
Markets analyst, news editor, and trading instructor with over 14 years of experience across FX, commodities, US equity indices, and global macro markets.